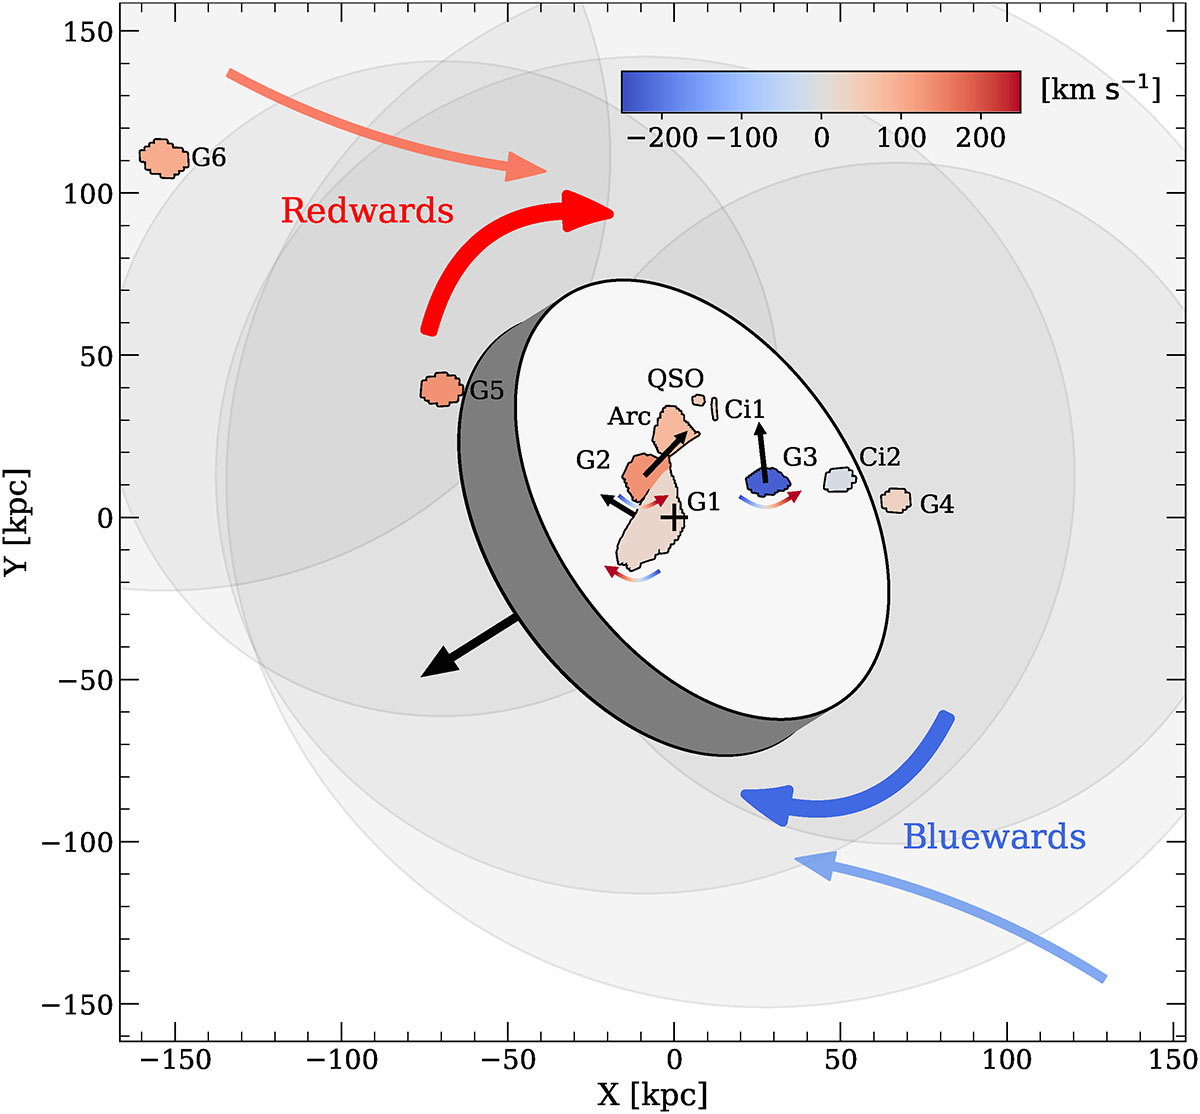
Fig. 5.
Download original image
Schematic of the orientation and kinematics of the IGrM in the compact galaxy group in the field of SGAS J0033+02. Each region is colour-coded based on the mean velocity offset of the observed Mg II (or [O II]) gas relative to the mass-weighted mean redshift of G1–G5 (z = 1.16648). The axes (black arrows) and directions (blue and/or red arrows) of rotation of G1, G2, G3, and the IGrM are indicated. The shaded, overlapping circles denote the extent of one virial radius around each galaxy.
Current usage metrics show cumulative count of Article Views (full-text article views including HTML views, PDF and ePub downloads, according to the available data) and Abstracts Views on Vision4Press platform.
Data correspond to usage on the plateform after 2015. The current usage metrics is available 48-96 hours after online publication and is updated daily on week days.
Initial download of the metrics may take a while.