Fig. A.1.
Download original image
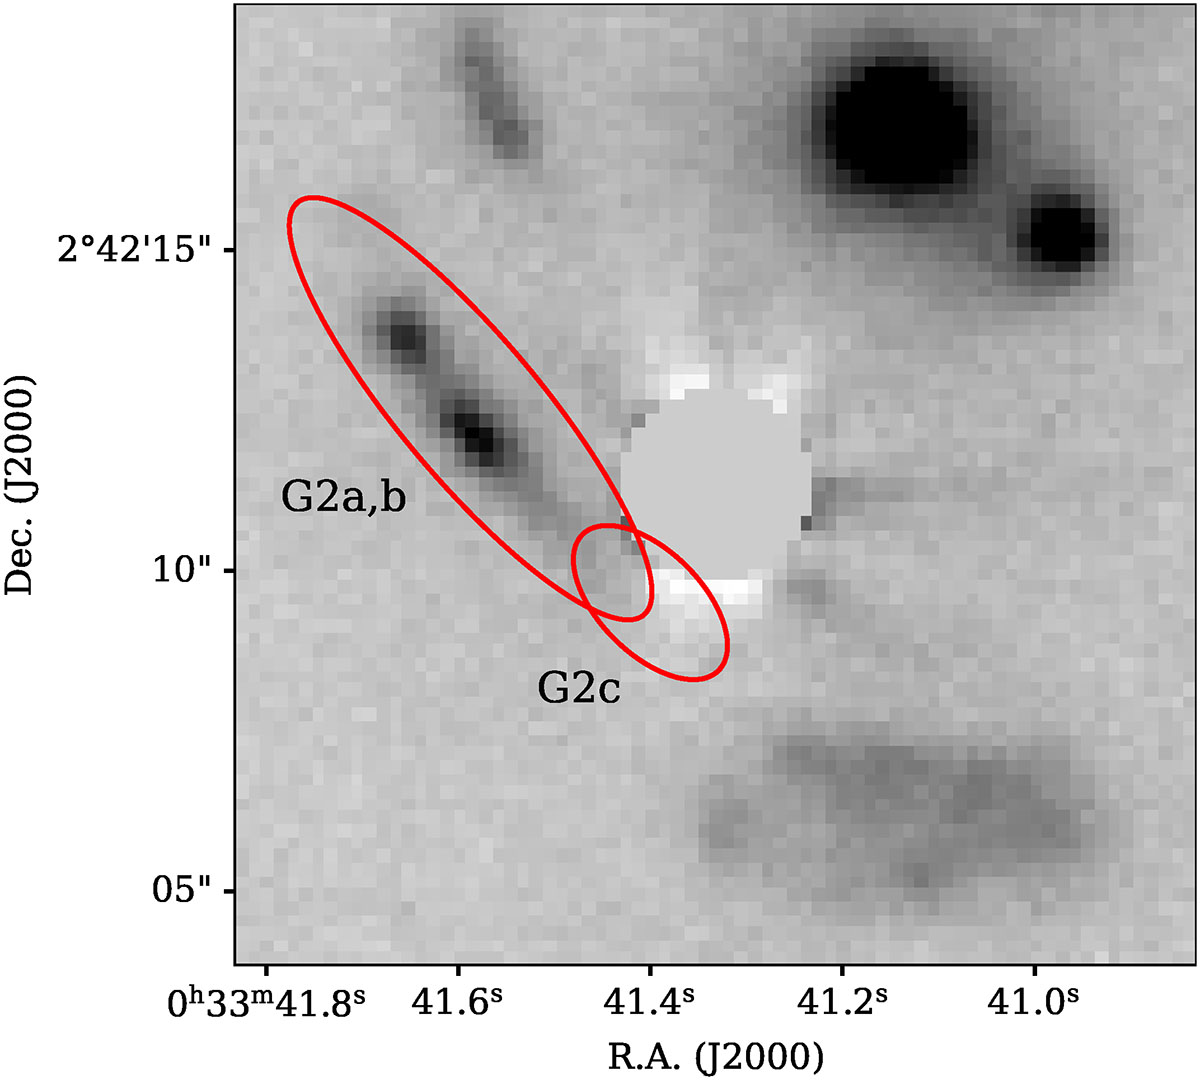
Point Spread Function subtraction and aperture masking of the Galactic star located between G1 (southwest) and G2 (east) in a MUSE narrow-band image centred on [O II] emission at z = 1.17. Light in this image may also arise from continuum emission. G2a and G2b refer to the brightest knots within G2. G2c denotes the region of G2 nearest to the stellar core (masked out) where [O II] emission can be detected.
Current usage metrics show cumulative count of Article Views (full-text article views including HTML views, PDF and ePub downloads, according to the available data) and Abstracts Views on Vision4Press platform.
Data correspond to usage on the plateform after 2015. The current usage metrics is available 48-96 hours after online publication and is updated daily on week days.
Initial download of the metrics may take a while.