Fig. 1.
Download original image
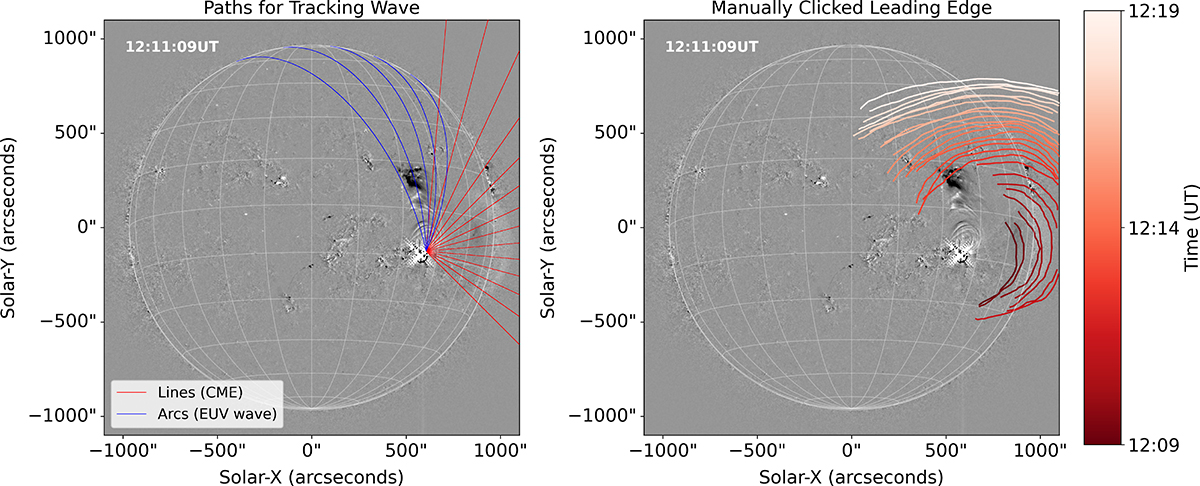
AIA 211 Å running difference images from 12:11:09 UT on 10 March 2024. Left: Paths used for tracking the EUV wave plotted on an AIA 211 Å running-difference image offset by 1 minute. Right: Manually identified leading-edge fronts for 27 running-difference images (12:09:33–12:19:33 UT) overplotted on the 12:11:09 UT image. Each front is shown in a unique shade of red to indicate its timing. The online version provides this information in a online.
Current usage metrics show cumulative count of Article Views (full-text article views including HTML views, PDF and ePub downloads, according to the available data) and Abstracts Views on Vision4Press platform.
Data correspond to usage on the plateform after 2015. The current usage metrics is available 48-96 hours after online publication and is updated daily on week days.
Initial download of the metrics may take a while.