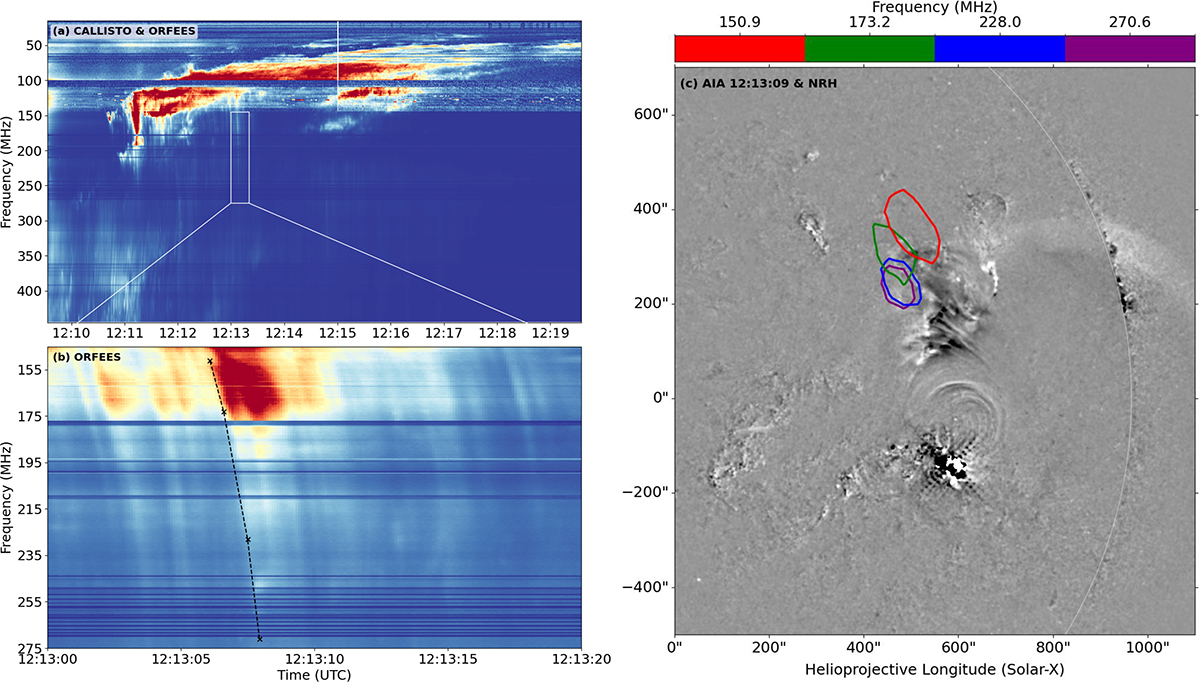
Fig. 2.
Download original image
(a): Type II radio burst seen in the dynamic spectra, captured between approximately 240 and 40 MHz from approximately 12:11:30 UT to 12:20:45 UT by ORFEES and CALLISTO in Greenland and Algeria. The colour map used in this dynamic spectrum is not representative of the actual relative intensities; it was normalised differently across the two datasets to highlight the type II feature for the reader. (b): Zoom-in on ORFEES herringbones between 12:13:00 UT and 12:13:20 UT. The points identifying one of these herringbones are shown at frequencies corresponding to the NRH contours on the right (black crosses, dashed black connecting line). (c): 211 Å running-difference image from 12:13:09 UT with NRH contours over-plotted between 150.9 MHz and 270.6 MHz. The EUV wave has just passed over the open field region, and reverse herringbone emission has been triggered. The plotted contours show the path of the identified herringbone. The online version provides this information in a online.
Current usage metrics show cumulative count of Article Views (full-text article views including HTML views, PDF and ePub downloads, according to the available data) and Abstracts Views on Vision4Press platform.
Data correspond to usage on the plateform after 2015. The current usage metrics is available 48-96 hours after online publication and is updated daily on week days.
Initial download of the metrics may take a while.