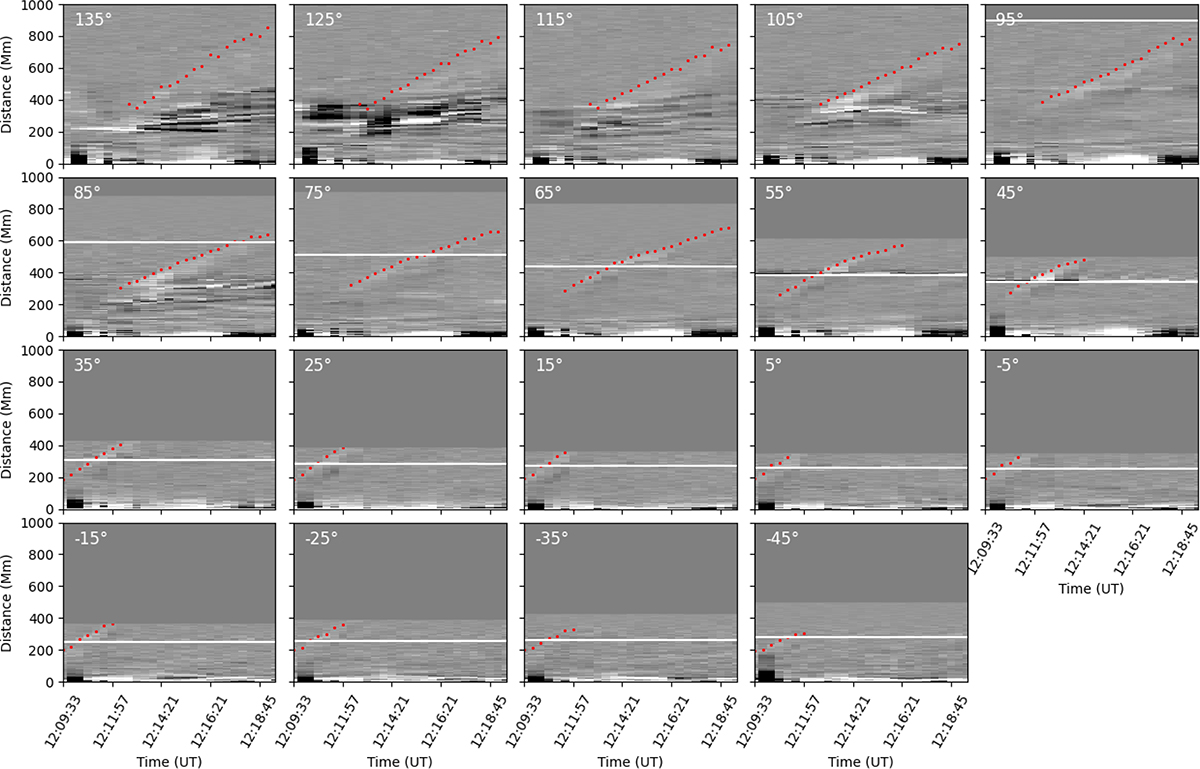
Fig. 3.
Download original image
Stack-plots for each path, shown in the left hand side of Fig. 1 organised by decreasing angle (top left to bottom right). The stack-plots in the top row correspond to those along great arc paths, and the others correspond to those along straight line paths. The horizontal white line denotes the distance from AR13599 to the limb along the relevant path. For each frame where the wave is visible along the path in question, the distance from the AR of the nearest clicked point to the path is shown in red.
Current usage metrics show cumulative count of Article Views (full-text article views including HTML views, PDF and ePub downloads, according to the available data) and Abstracts Views on Vision4Press platform.
Data correspond to usage on the plateform after 2015. The current usage metrics is available 48-96 hours after online publication and is updated daily on week days.
Initial download of the metrics may take a while.