Fig. 4.
Download original image
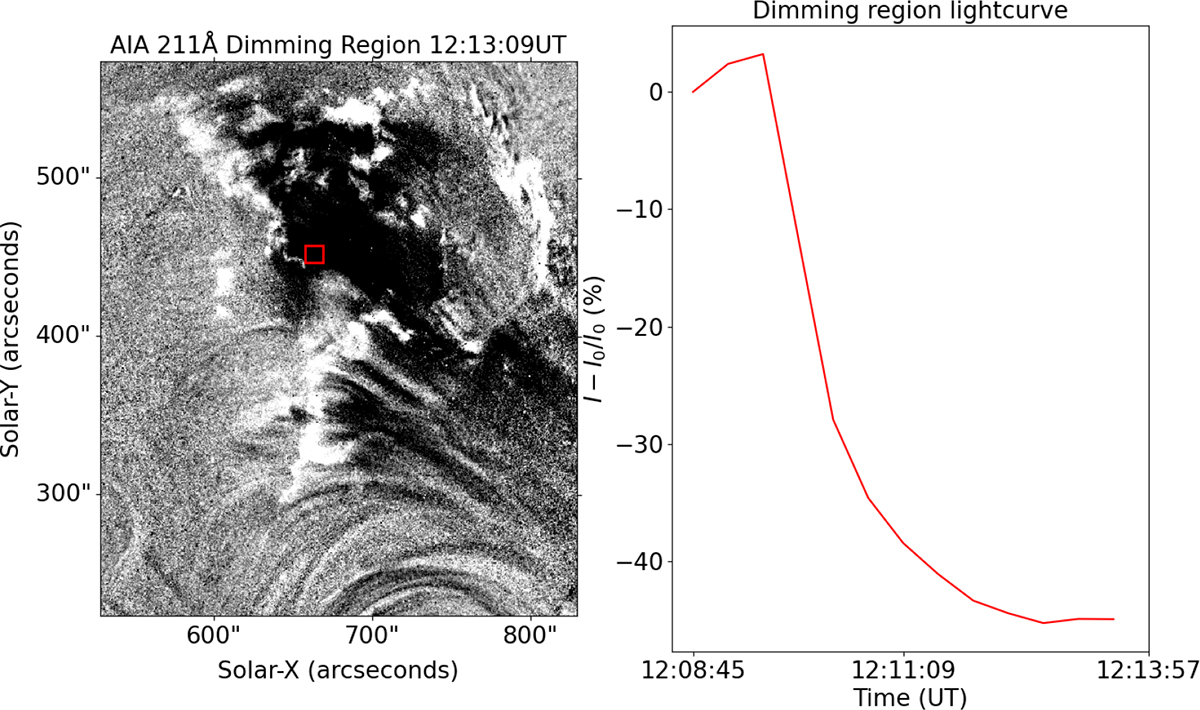
Left: 211 Å base-difference ratio image of the area surrounding AR13602, at 12:13:09UT, using a quiet-time base frame from 12:08:45UT. The red box indicates the subregion, which the light curve on the right corresponds to. This subregion was identified as remaining within the dimming region throughout the period when dimming occurred. Right: Base-difference ratio light curve for the subregion, dimming by up to 45.77%.
Current usage metrics show cumulative count of Article Views (full-text article views including HTML views, PDF and ePub downloads, according to the available data) and Abstracts Views on Vision4Press platform.
Data correspond to usage on the plateform after 2015. The current usage metrics is available 48-96 hours after online publication and is updated daily on week days.
Initial download of the metrics may take a while.