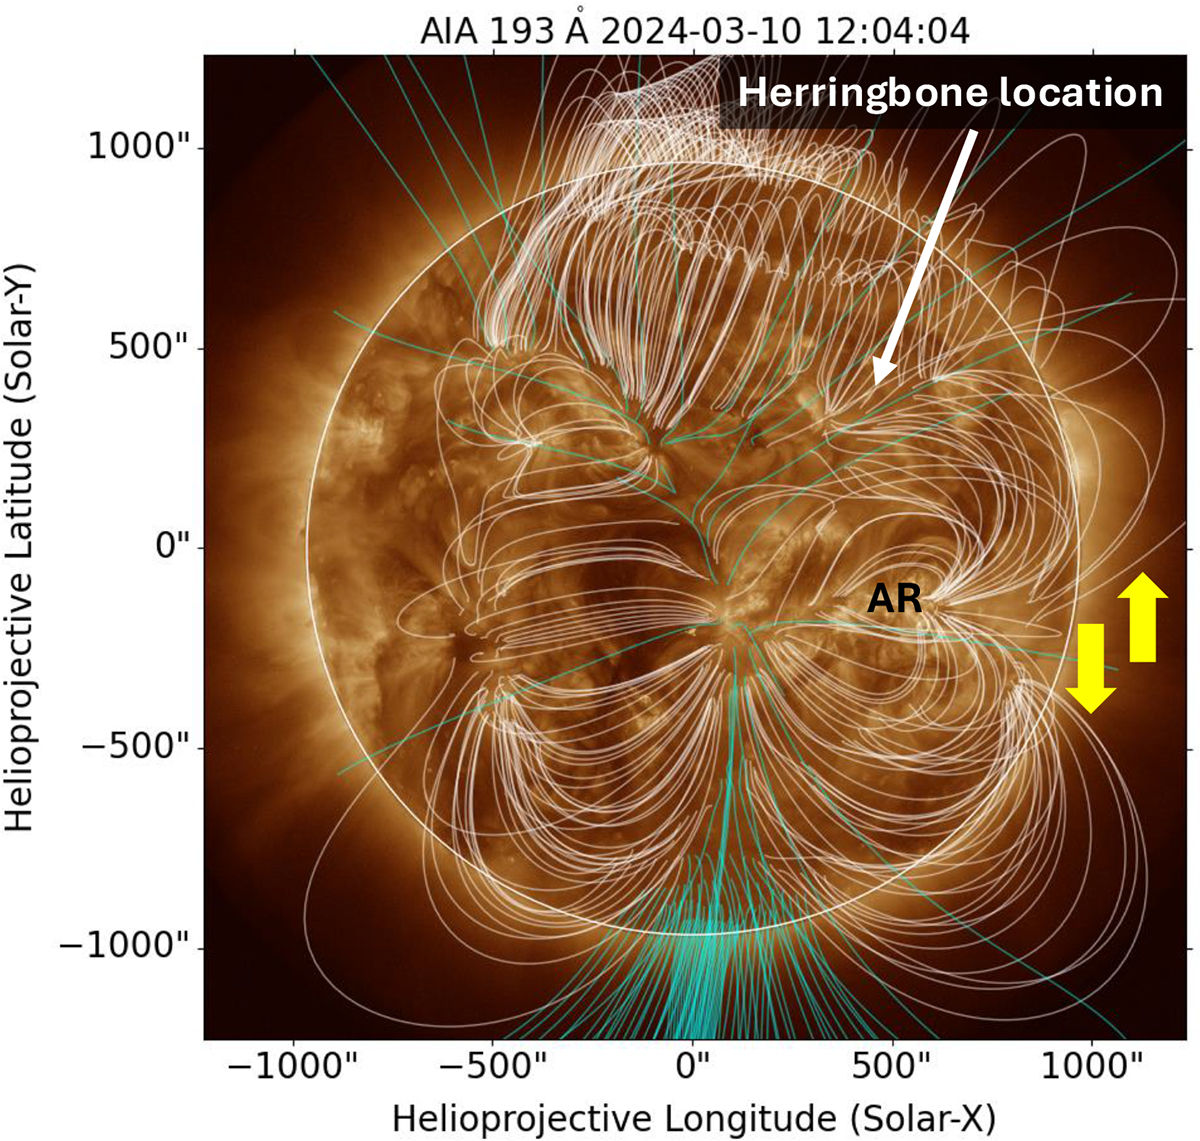
Fig. 6.
Download original image
PFSS magnetic field extrapolation just before the flare. The field lines are plotted on an AIA 193 Å image. The closed field lines are in white, and the open field lines are in cyan. The location of the herringbone contours in AR13602 is as indicated. The yellow arrows highlight the large loop systems to the north and south of the flaring active region, which is marked by the ‘AR’ label.
Current usage metrics show cumulative count of Article Views (full-text article views including HTML views, PDF and ePub downloads, according to the available data) and Abstracts Views on Vision4Press platform.
Data correspond to usage on the plateform after 2015. The current usage metrics is available 48-96 hours after online publication and is updated daily on week days.
Initial download of the metrics may take a while.