Fig. 12
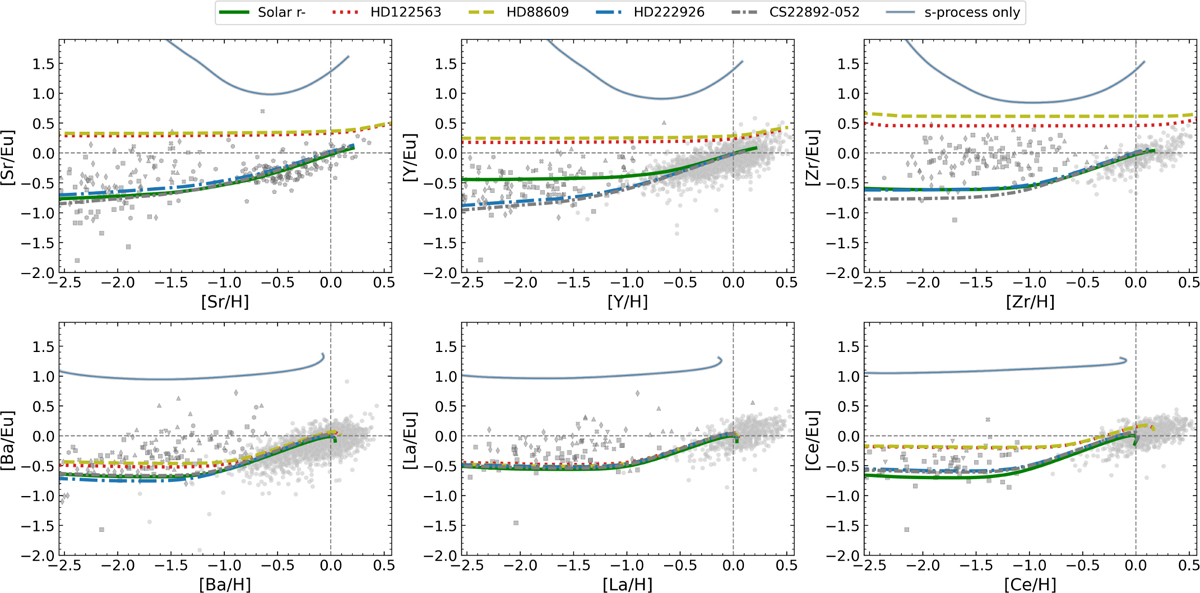
Download original image
Observed and predicted abundance ratios of [X/Eu] vs [X/H] for the first- and second-peak neutron-capture elements (Sr, Y, Zr, Ba, La, Ce). Grey symbols show observational data with the same symbol types as in previous figures, while coloured lines represent model predictions using different scaling relations: the solar r-/s-process pattern (solid green/grey), HD 122563 (dotted red), HD 88609 (dashed yellow), HD 222925 (dash-dotted blue), and CS 22892-052 (dash-dotted grey). Symbols for the observational data are the same as in Figure 3.
Current usage metrics show cumulative count of Article Views (full-text article views including HTML views, PDF and ePub downloads, according to the available data) and Abstracts Views on Vision4Press platform.
Data correspond to usage on the plateform after 2015. The current usage metrics is available 48-96 hours after online publication and is updated daily on week days.
Initial download of the metrics may take a while.