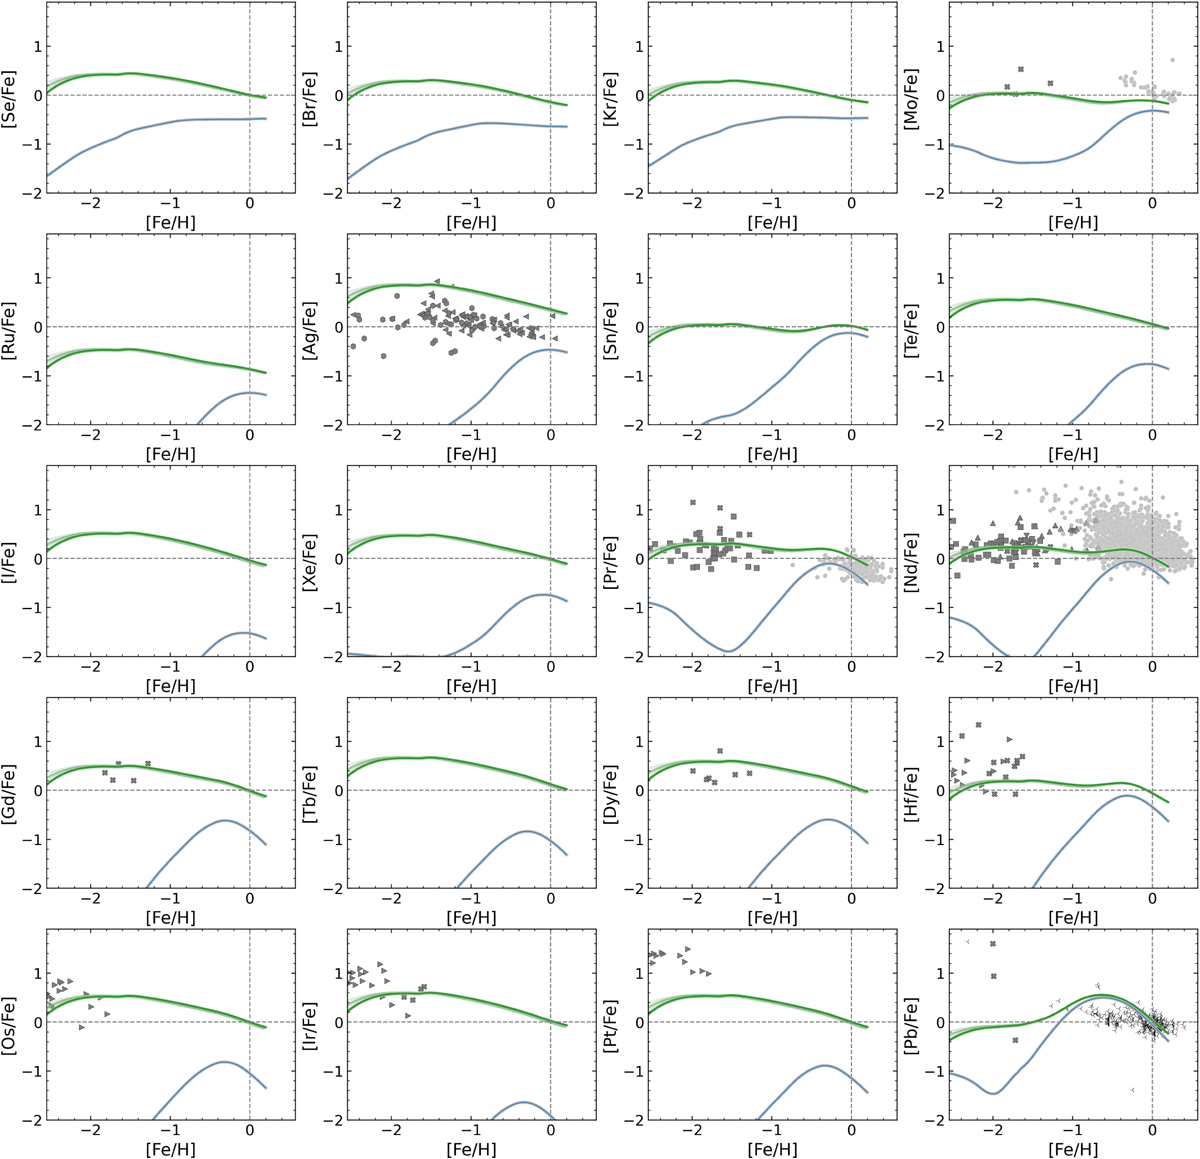
Fig. B.1
Download original image
Comparison between observed [X/Fe] vs [Fe/H] trends and the predictions of the best Eu models for the other neutron-capture elements included in the model. Symbols for the observational data are the same as in Figure 3, with the addition of observations from Wu et al. (2015) for Ag (grey left-triangles), Alencastro Puls et al. (2025) for Hf, Os, Ir and Pt (grey right-triangles) and from Contursi et al. (2024) for Pb (grey small right-triangles).
Current usage metrics show cumulative count of Article Views (full-text article views including HTML views, PDF and ePub downloads, according to the available data) and Abstracts Views on Vision4Press platform.
Data correspond to usage on the plateform after 2015. The current usage metrics is available 48-96 hours after online publication and is updated daily on week days.
Initial download of the metrics may take a while.