Fig. 4
Download original image
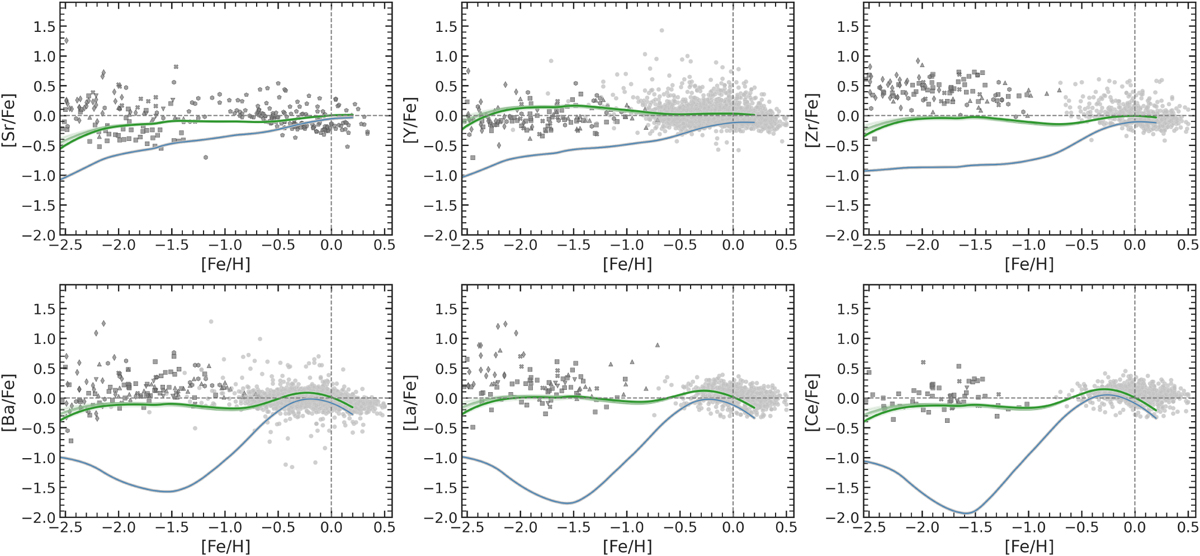
Observed and predicted [X/Fe] vs [Fe/H] trends for Sr, Y, Zr and for Ba, La, Ce. Solid green curves show the predicted trend for the best-fitting [Eu/Fe] vs. [Fe/H] trend, while lighter green lines represent that range spanned by models within the top 100. The lower light blue lines represent the results of the model in case there is only the s-process contribution. Symbols for the observational data are the same as in Figure 3.
Current usage metrics show cumulative count of Article Views (full-text article views including HTML views, PDF and ePub downloads, according to the available data) and Abstracts Views on Vision4Press platform.
Data correspond to usage on the plateform after 2015. The current usage metrics is available 48-96 hours after online publication and is updated daily on week days.
Initial download of the metrics may take a while.