Fig. 5
Download original image
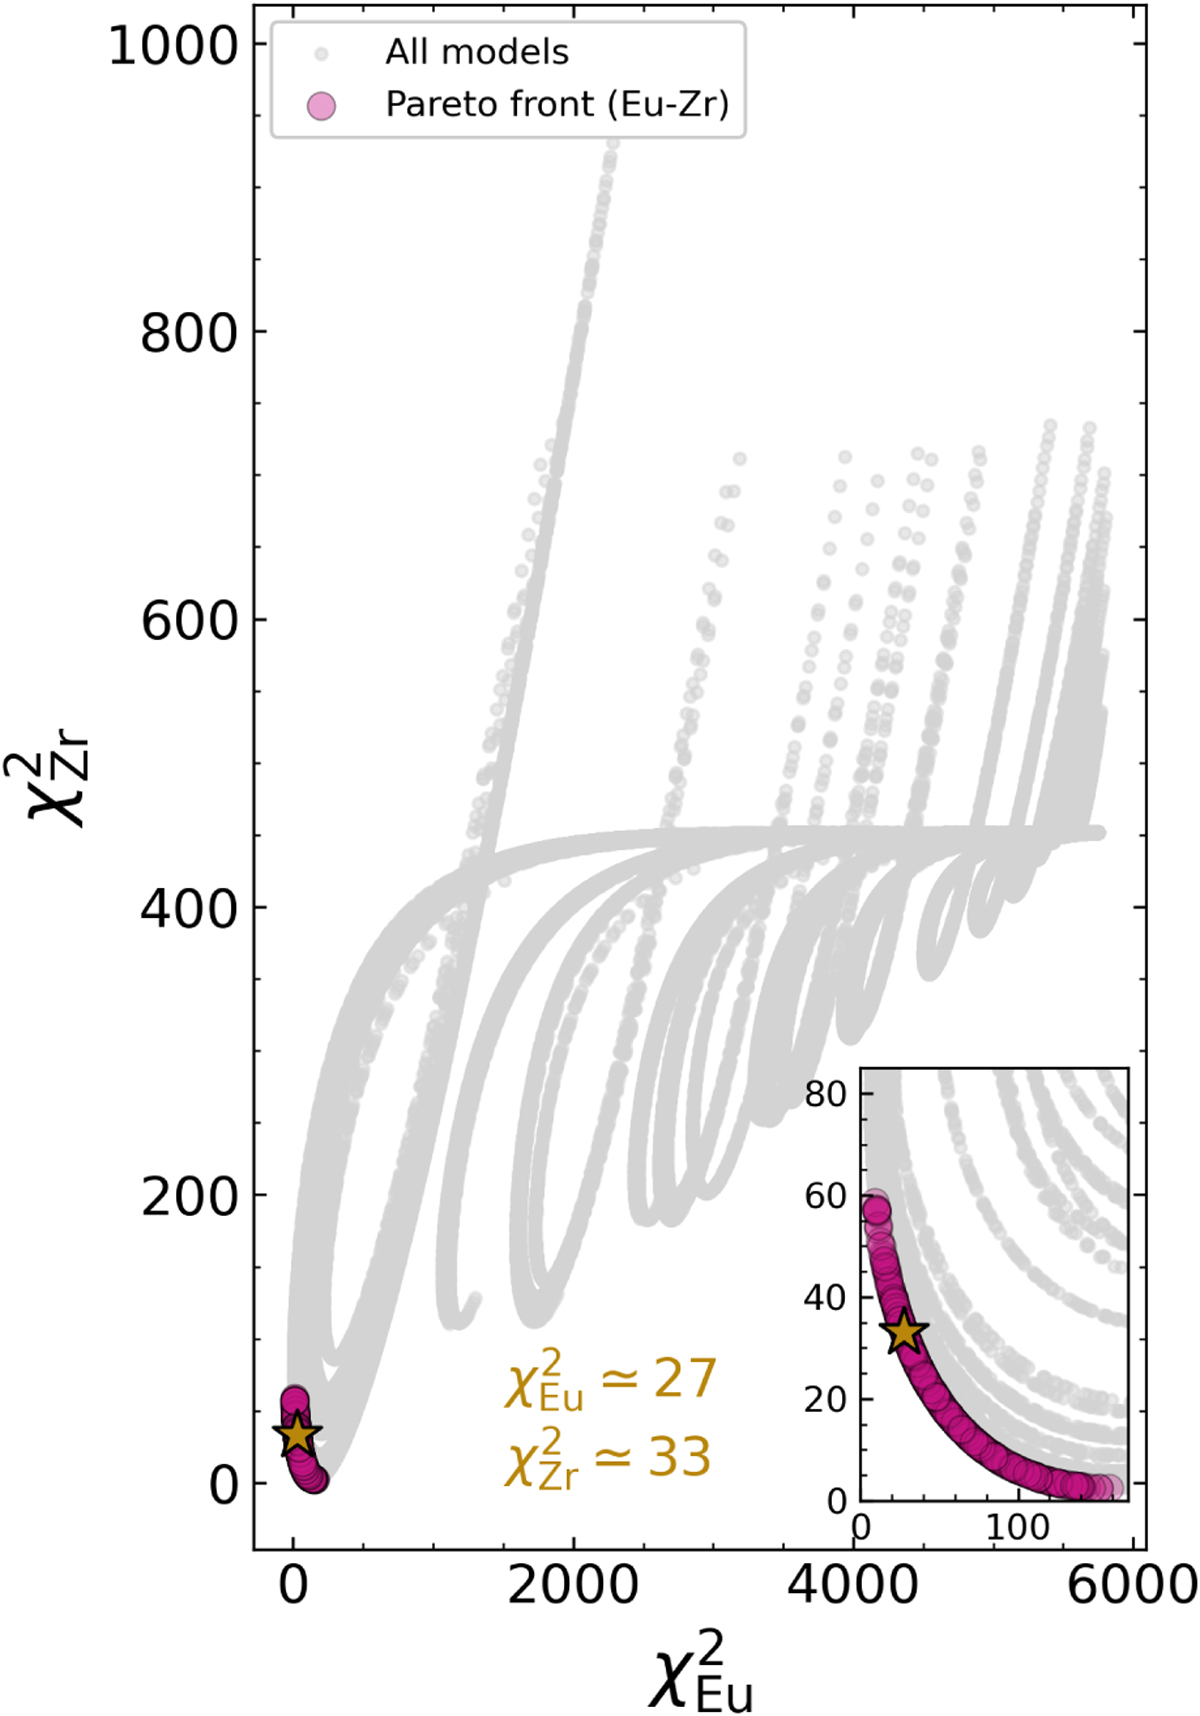
Reduced χ2 values for [Eu/Fe] vs. [Fe/H] and [Zr/Fe] vs. [Fe/H]. Grey points show all computed models, while magenta points highlight the Pareto-optimal solutions for the Eu–Zr pair, corresponding to the lower-left boundary of the objective space. The zoomed plot shows the low–χ2 region, where the optimal compromise between ![]() and
and ![]() is located (yellow star).
is located (yellow star).
Current usage metrics show cumulative count of Article Views (full-text article views including HTML views, PDF and ePub downloads, according to the available data) and Abstracts Views on Vision4Press platform.
Data correspond to usage on the plateform after 2015. The current usage metrics is available 48-96 hours after online publication and is updated daily on week days.
Initial download of the metrics may take a while.