Open Access
Fig. 3.
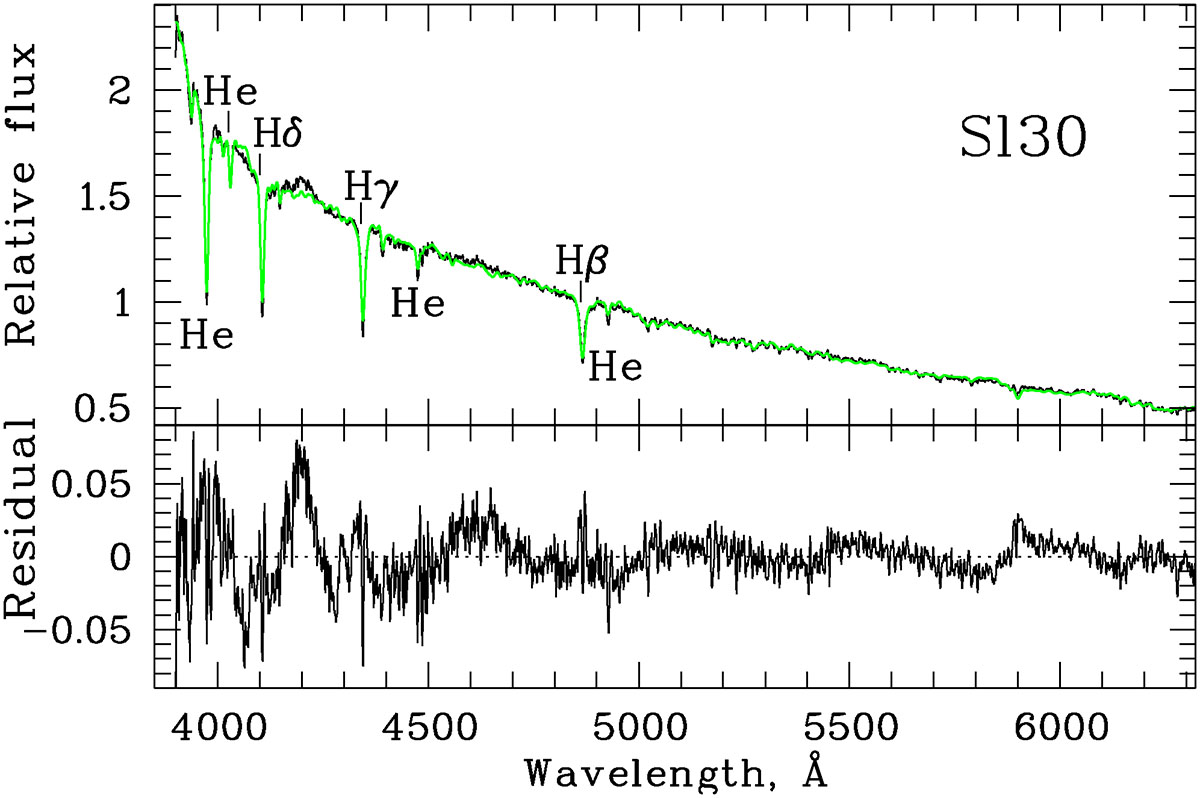
Download original image
Comparison of the Slit 30 spectrum of the SC Larsen (1999)-298 = Mora et al. (2009) 1-2 in NGC 7793 (black) with a composite model (green). Bottom: Difference between the observed and the model spectra (see Sect. 4.2 for details).
Current usage metrics show cumulative count of Article Views (full-text article views including HTML views, PDF and ePub downloads, according to the available data) and Abstracts Views on Vision4Press platform.
Data correspond to usage on the plateform after 2015. The current usage metrics is available 48-96 hours after online publication and is updated daily on week days.
Initial download of the metrics may take a while.