Fig. 2.
Download original image
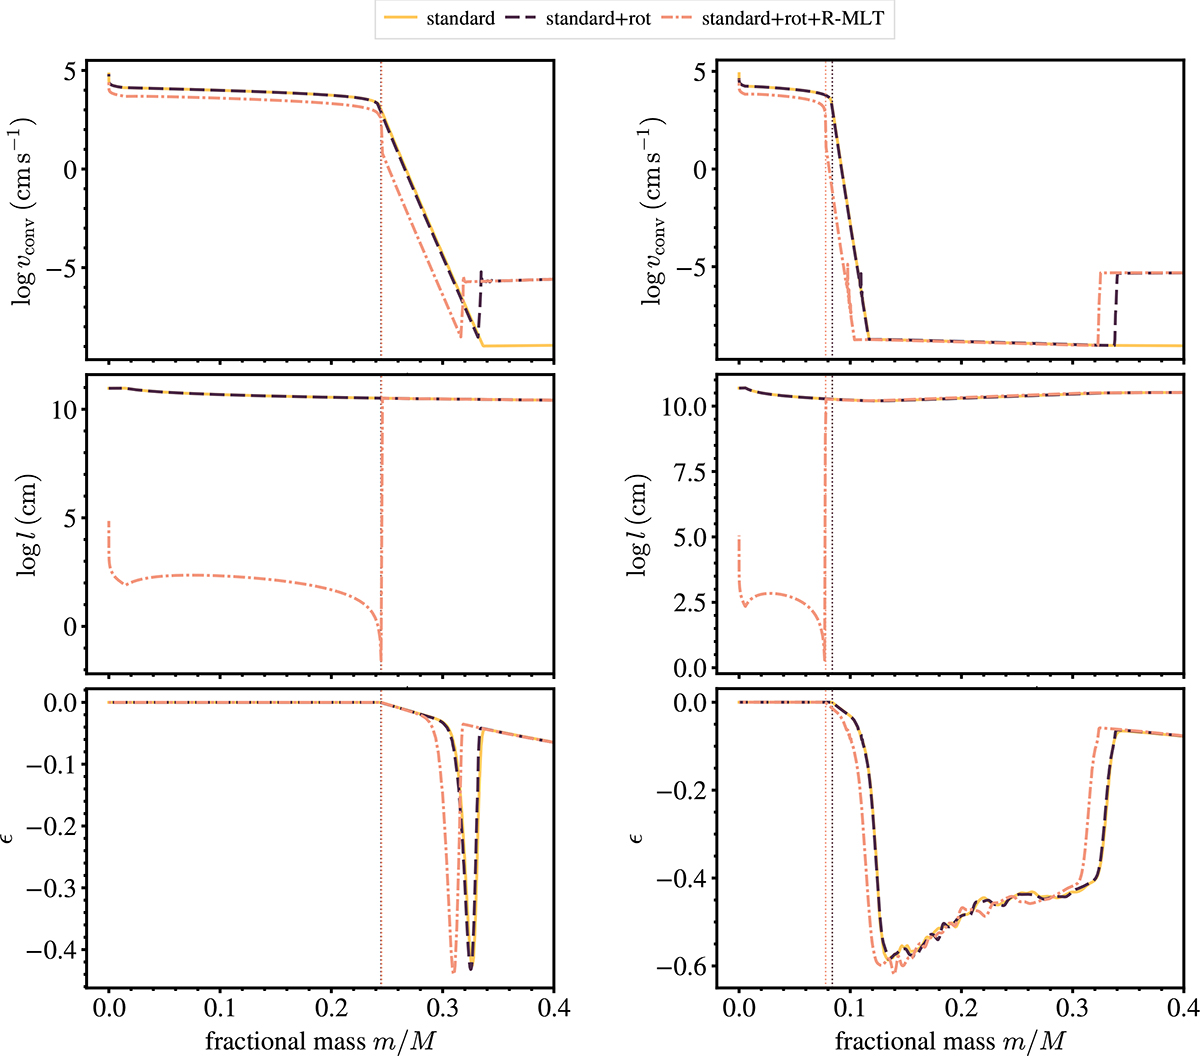
ZAMS (left) and TAMS (right) profiles of the region containing the inner 40 percent in mass of the three sets of 5 M⊙ stellar models described in Sect. 2, showing the variation of the MLT variables: convective velocity on the top, mixing length in the middle, and degree of superadiabaticity at the bottom. The solid yellow lines correspond to the non-rotating model, the dashed purple lines correspond to the model with rotation and standard MLT, and the dashed-dotted orange lines correspond to the model with rotation and R-MLT. The vertical dotted line of the corresponding colour in each panel denotes the boundary of the convective core.
Current usage metrics show cumulative count of Article Views (full-text article views including HTML views, PDF and ePub downloads, according to the available data) and Abstracts Views on Vision4Press platform.
Data correspond to usage on the plateform after 2015. The current usage metrics is available 48-96 hours after online publication and is updated daily on week days.
Initial download of the metrics may take a while.