Fig. 3.
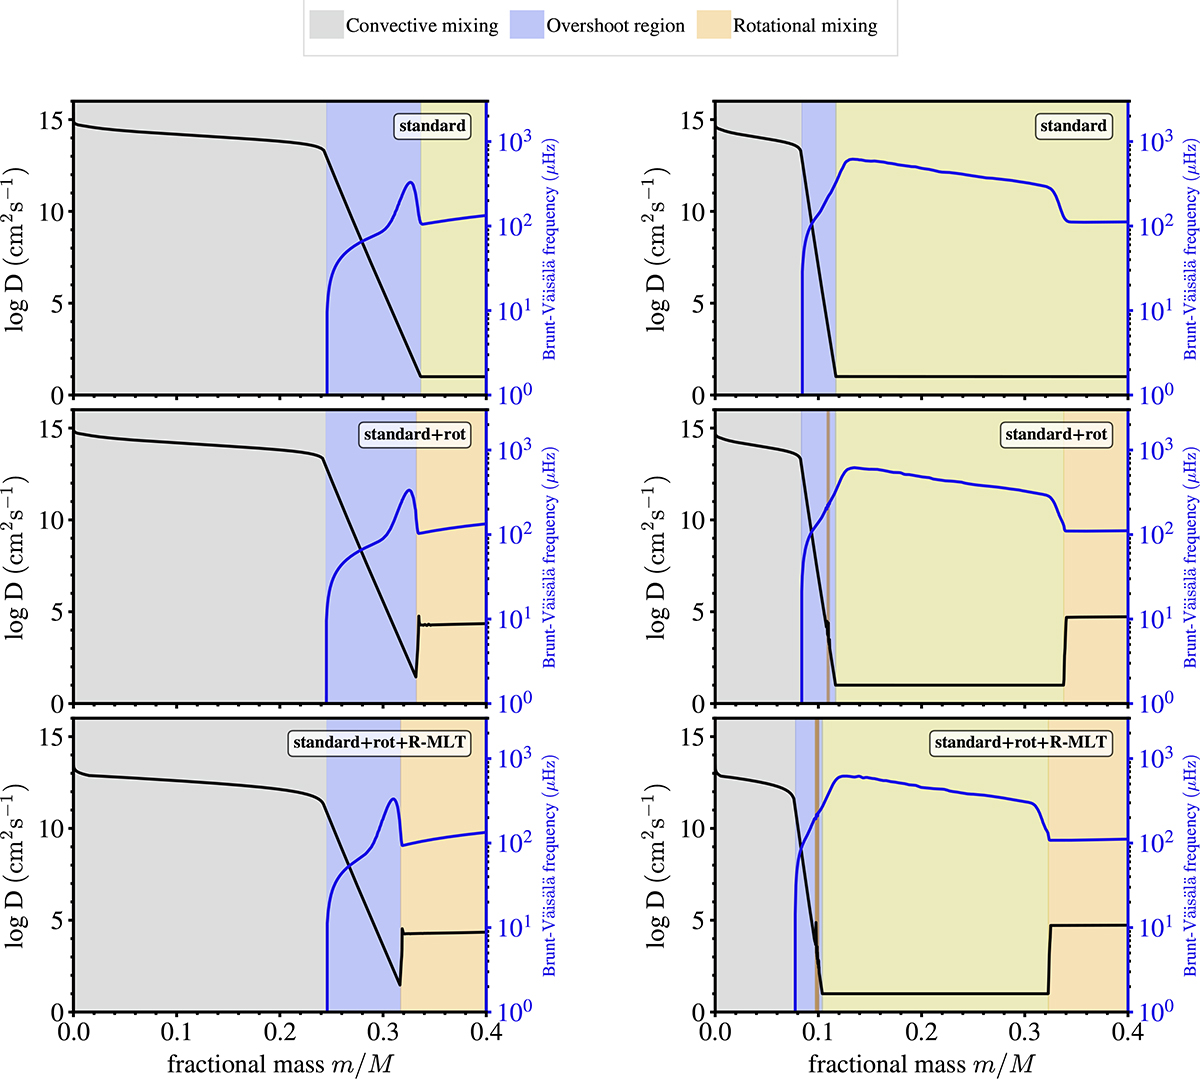
Download original image
Mixing coefficient (black) and Brunt–Väisälä frequency (blue) for the same region and stellar models as shown in Fig. 2. Profiles near the ZAMS are on the left-hand side, with the non-rotating model on the top, the model with rotation and standard MLT in the middle, and the model with rotation and R-MLT at the bottom. The corresponding profiles at the TAMS are displayed in the right-hand panels. Background shading indicates the dominant mixing mechanism in different stellar layers: grey for convection, purple for overshoot, green for the radiative envelope, and orange for the envelope with rotational mixing.
Current usage metrics show cumulative count of Article Views (full-text article views including HTML views, PDF and ePub downloads, according to the available data) and Abstracts Views on Vision4Press platform.
Data correspond to usage on the plateform after 2015. The current usage metrics is available 48-96 hours after online publication and is updated daily on week days.
Initial download of the metrics may take a while.