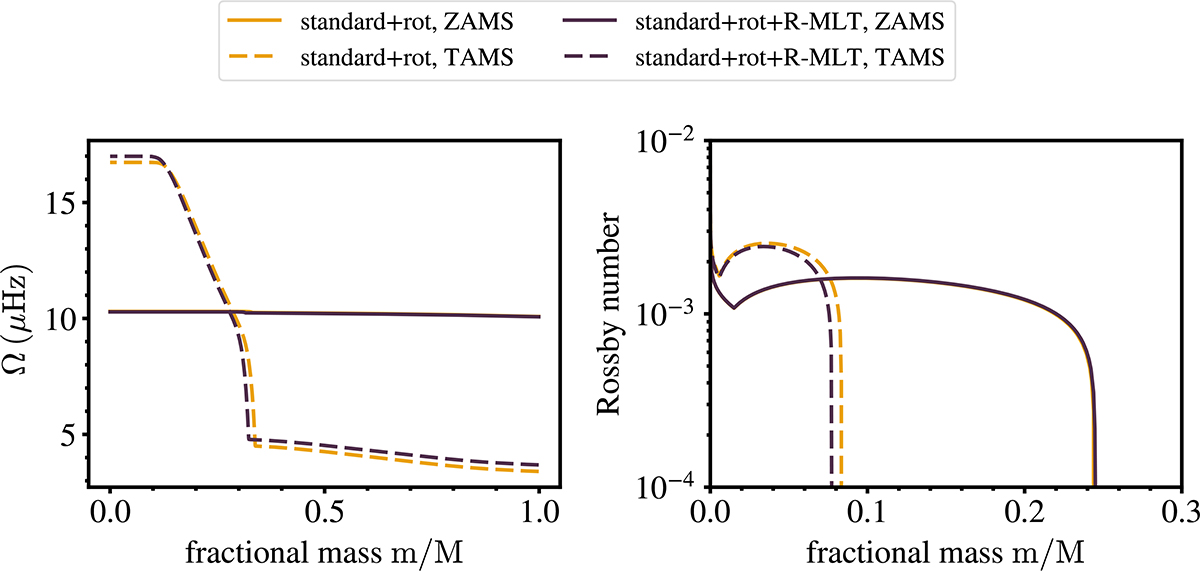
Fig. 4.
Download original image
Rotation frequency profiles for rotating models computed with standard MLT (dark purple) and with R-MLT (yellow) in the convective regions. The corresponding Rossby number profiles are shown in the right panel. Both models begin with nearly identical rotation frequency distributions near the ZAMS (solid lines) but diverge by the TAMS (dashed lines), particularly beyond the fractional mass of about 0.32.
Current usage metrics show cumulative count of Article Views (full-text article views including HTML views, PDF and ePub downloads, according to the available data) and Abstracts Views on Vision4Press platform.
Data correspond to usage on the plateform after 2015. The current usage metrics is available 48-96 hours after online publication and is updated daily on week days.
Initial download of the metrics may take a while.