Fig. 5.
Download original image
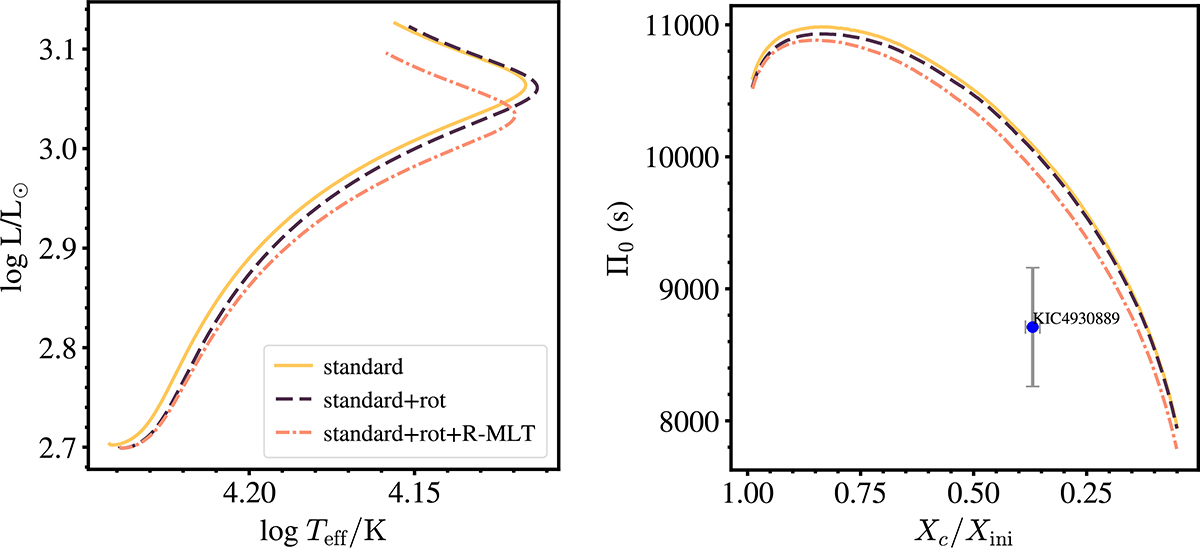
Left panel: Hertzsprung-Russell (HR) diagram showing the main-sequence evolution of a 5 M⊙ star. Right panel: Evolution of the buoyancy travel time as a function of the hydrogen mass fraction. The solid yellow line represents the non-rotating model computed with standard MLT in the convective zones; the dashed purple line corresponds to the rotating model with rotational mixing in the radiative zones and standard MLT in the convective zones; and the dash-dotted orange line shows the rotating model but with R-MLT instead of standard MLT in the convective zones.
Current usage metrics show cumulative count of Article Views (full-text article views including HTML views, PDF and ePub downloads, according to the available data) and Abstracts Views on Vision4Press platform.
Data correspond to usage on the plateform after 2015. The current usage metrics is available 48-96 hours after online publication and is updated daily on week days.
Initial download of the metrics may take a while.