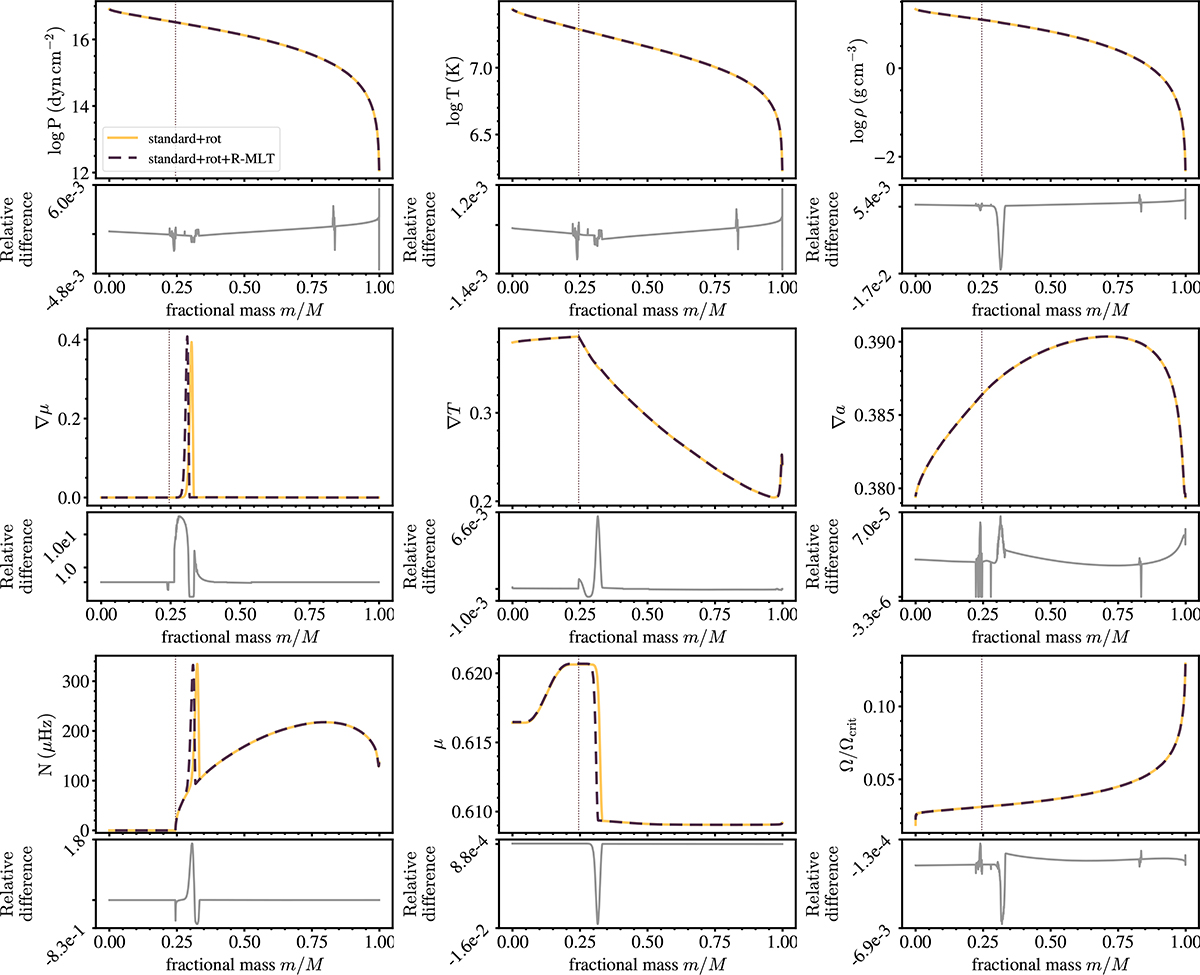
Fig. A.1.
Download original image
Internal structure of a 5 M⊙ ZAMS model with initial rotation frequency 20 percent of the critical frequency at the surface, computed with standard MLT (solid yellow lines) and R-MLT (dashed purple lines). Each of the nine panels shows pressure (log P), temperature (log T), density (log ρ), chemical gradient (∇μ), actual temperature gradient (∇T), adiabatic temperature gradient (∇ad), Brunt-Väisälä frequency (N), mean molecular weight per particle (ions + free electrons, μ), and fractional rotation frequency (Ω/Ωcrit) as functions of fractional mass. Upper subplots show the absolute profiles for both models, and lower subplots show their relative differences, (Xrot + R − MLT − Xrot)/Xrot. Vertical dotted lines of the corresponding colour in the upper plots show the convective boundary for each model. Surface points have been removed for clarity.
Current usage metrics show cumulative count of Article Views (full-text article views including HTML views, PDF and ePub downloads, according to the available data) and Abstracts Views on Vision4Press platform.
Data correspond to usage on the plateform after 2015. The current usage metrics is available 48-96 hours after online publication and is updated daily on week days.
Initial download of the metrics may take a while.