Open Access
Fig. 3
Download original image
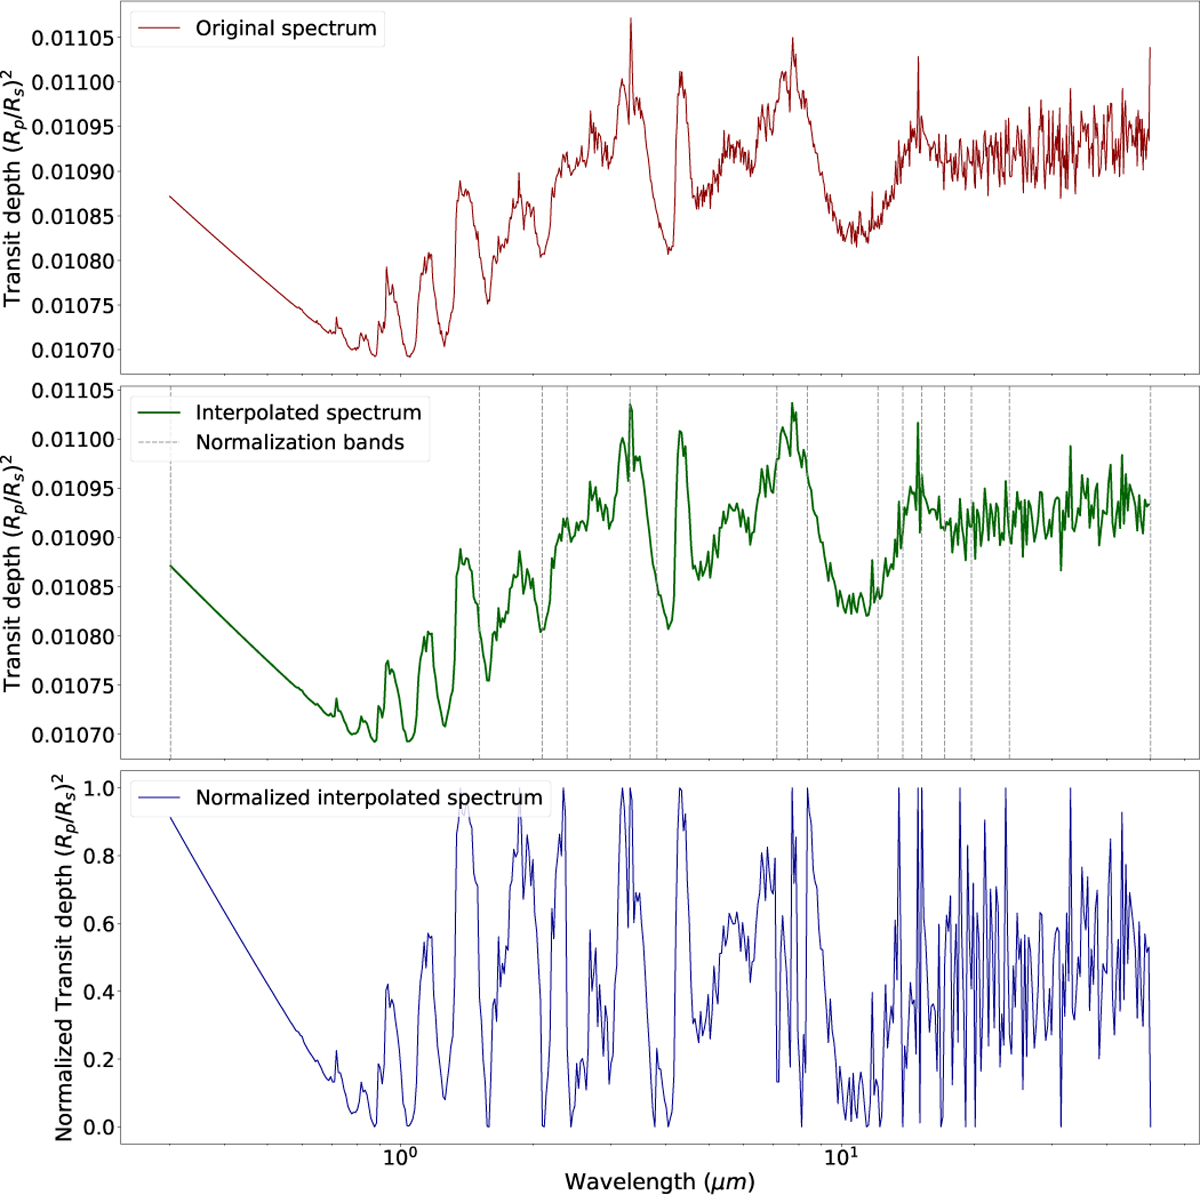
Preprocessing phases on the test planet spectrum in Table 2. Upper plot: analytical spectrum computed using the TauREx forward model. Middle plot: analytical spectrum binned to the custom grid and normalization bands. Bottom plot: interpolated spectrum after normalization.
Current usage metrics show cumulative count of Article Views (full-text article views including HTML views, PDF and ePub downloads, according to the available data) and Abstracts Views on Vision4Press platform.
Data correspond to usage on the plateform after 2015. The current usage metrics is available 48-96 hours after online publication and is updated daily on week days.
Initial download of the metrics may take a while.