Open Access
Fig. 4
Download original image
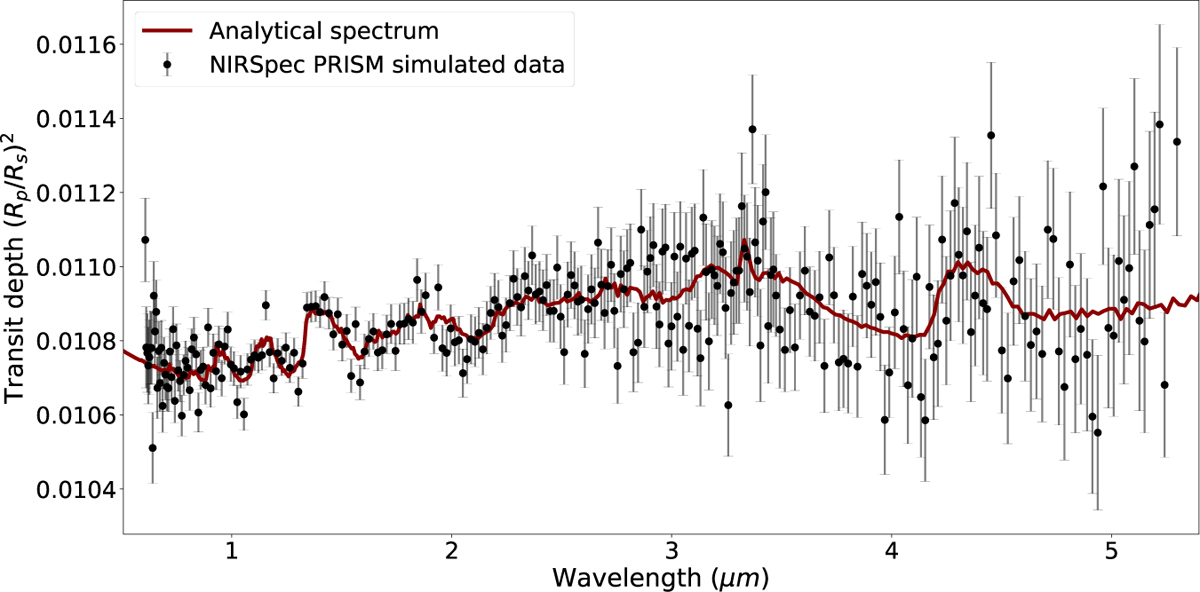
Simulated NIRSpec PRISM observation of the transmission spectrum in Fig. 3. The observational data points (black dots) are binned to the native resolution of NIRSpec PRISM (R = 100) and superimposed on the original (red line) Tau-REx analytical spectrum.
Current usage metrics show cumulative count of Article Views (full-text article views including HTML views, PDF and ePub downloads, according to the available data) and Abstracts Views on Vision4Press platform.
Data correspond to usage on the plateform after 2015. The current usage metrics is available 48-96 hours after online publication and is updated daily on week days.
Initial download of the metrics may take a while.