Fig. A.1.
Download original image
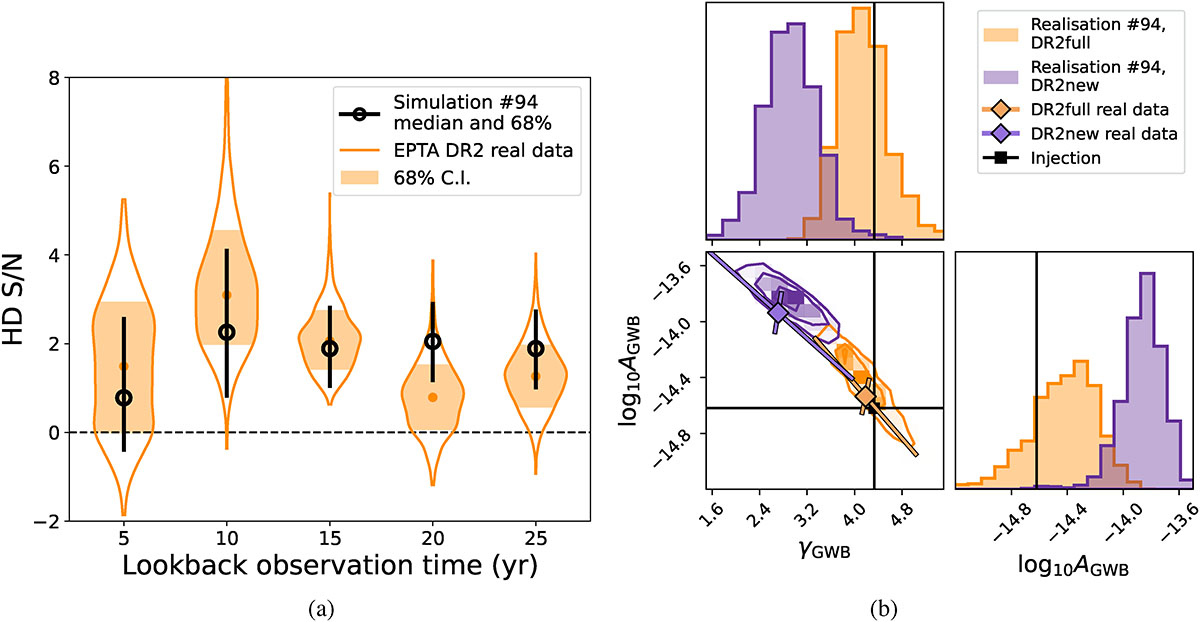
Panel (a): Median and 68%C.I. of the noise marginalised HD S/N computed with realisation 94 by cutting the dataset at different epochs. The same cuts were applied to the real EPTA DR2 and the violins shown the HD S/N distribution. Panel (b): Marginalised posterior distributions of γGWB and log10AGWB obtained from the DR2full and DR2new version of realisation 94. As a reference, the median values and 2σ covariance principal axes obtained from the real data are displayed.
Current usage metrics show cumulative count of Article Views (full-text article views including HTML views, PDF and ePub downloads, according to the available data) and Abstracts Views on Vision4Press platform.
Data correspond to usage on the plateform after 2015. The current usage metrics is available 48-96 hours after online publication and is updated daily on week days.
Initial download of the metrics may take a while.