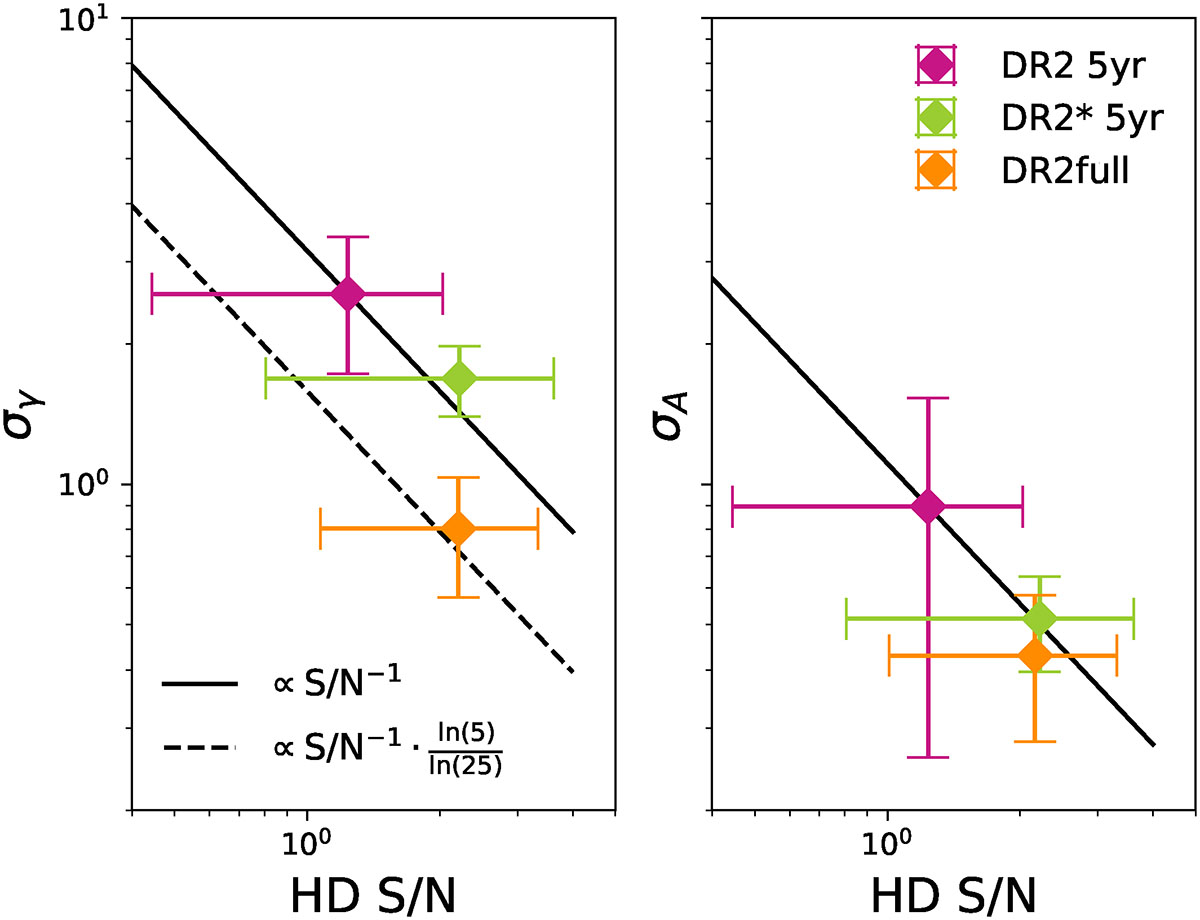
Fig. C.1.
Download original image
Mean and 68%C.I. of the error on γ (left) and on log10A (right) as a function of the mean and 68%C.I. of the HD S/N obtained from the simulations of DR2 5yr, DR2* 5yr and DR2full (25yr). The black solid line is the expected scaling ∝S/N−1, while the dashed line accounts for the term dependent on the observation time that influences the error on γ and not the one on log10A.
Current usage metrics show cumulative count of Article Views (full-text article views including HTML views, PDF and ePub downloads, according to the available data) and Abstracts Views on Vision4Press platform.
Data correspond to usage on the plateform after 2015. The current usage metrics is available 48-96 hours after online publication and is updated daily on week days.
Initial download of the metrics may take a while.