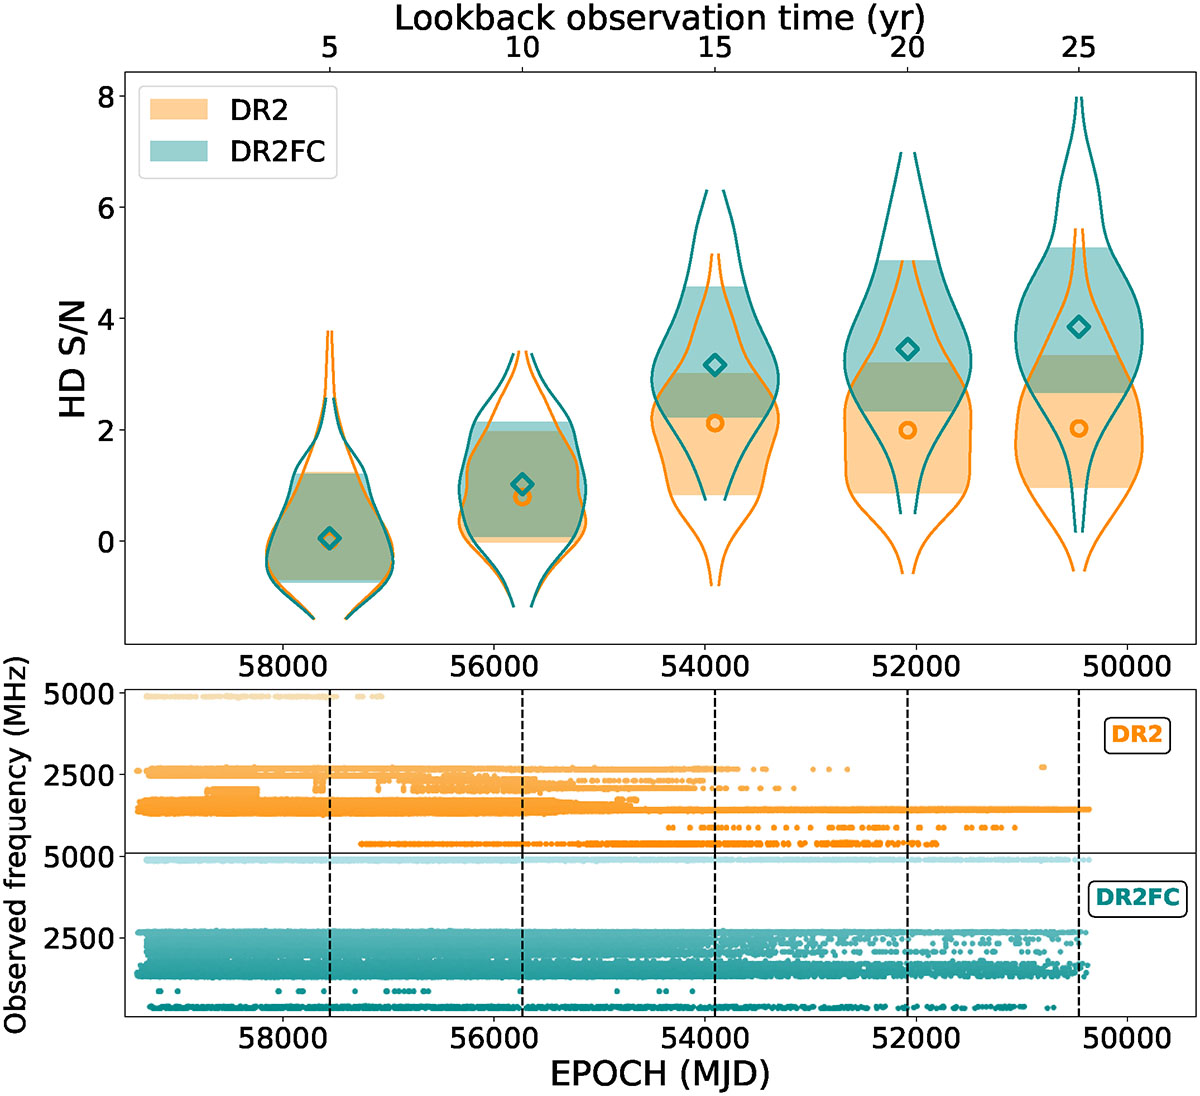
Fig. 2.
Download original image
Top: S/N distribution computed from the 100 realisations of DR2 (orange) and DR2FC (green). Bottom: difference in frequency coverage between the two kinds of datasets. The TOAs from all the pulsars are plotted together to highlight the drop in the frequency coverage occurring in DR2 at 15 yr from now, which corresponds to the plateau of its S/N.
Current usage metrics show cumulative count of Article Views (full-text article views including HTML views, PDF and ePub downloads, according to the available data) and Abstracts Views on Vision4Press platform.
Data correspond to usage on the plateform after 2015. The current usage metrics is available 48-96 hours after online publication and is updated daily on week days.
Initial download of the metrics may take a while.