Fig. 4.
Download original image
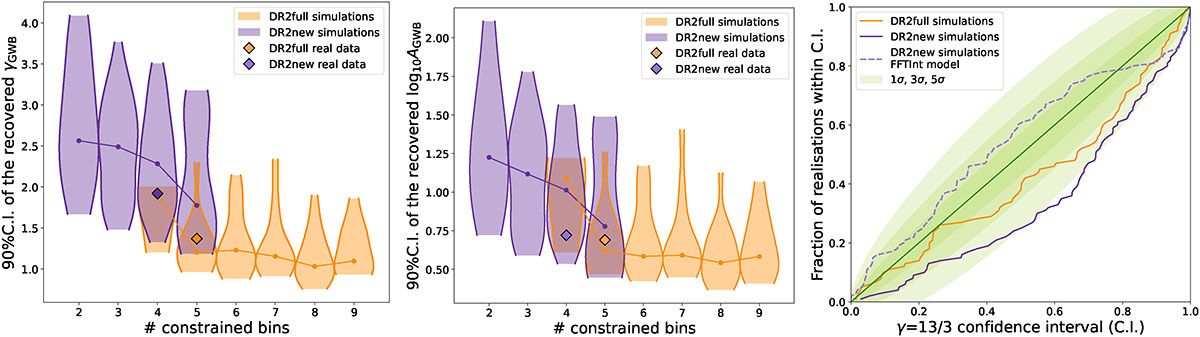
Comparison of the precision and accuracy of the GWB parameter estimation performed with DR2full (orange) and DR2new (purple). Panel (a): Distribution of the 90%C.I. width of the γGWB posterior distribution as a function of the number of frequency bins that are constrained in the freespectrum search. Panel (b): Distribution of the 90%C.I. width of the log10AGWB posterior distribution as a function of the number of frequency bins that are constrained in the freespectrum search. Panel (c): P-P plot computed with the marginalised posterior distribution of γGWB, taking as the true value the standard 13/3. The green diagonal represents the true shape of the P-P plot for a perfectly unbiased recovery, the shaded areas are the 1, 3, and 5σ C.I. given the number of data, which is 100.
Current usage metrics show cumulative count of Article Views (full-text article views including HTML views, PDF and ePub downloads, according to the available data) and Abstracts Views on Vision4Press platform.
Data correspond to usage on the plateform after 2015. The current usage metrics is available 48-96 hours after online publication and is updated daily on week days.
Initial download of the metrics may take a while.