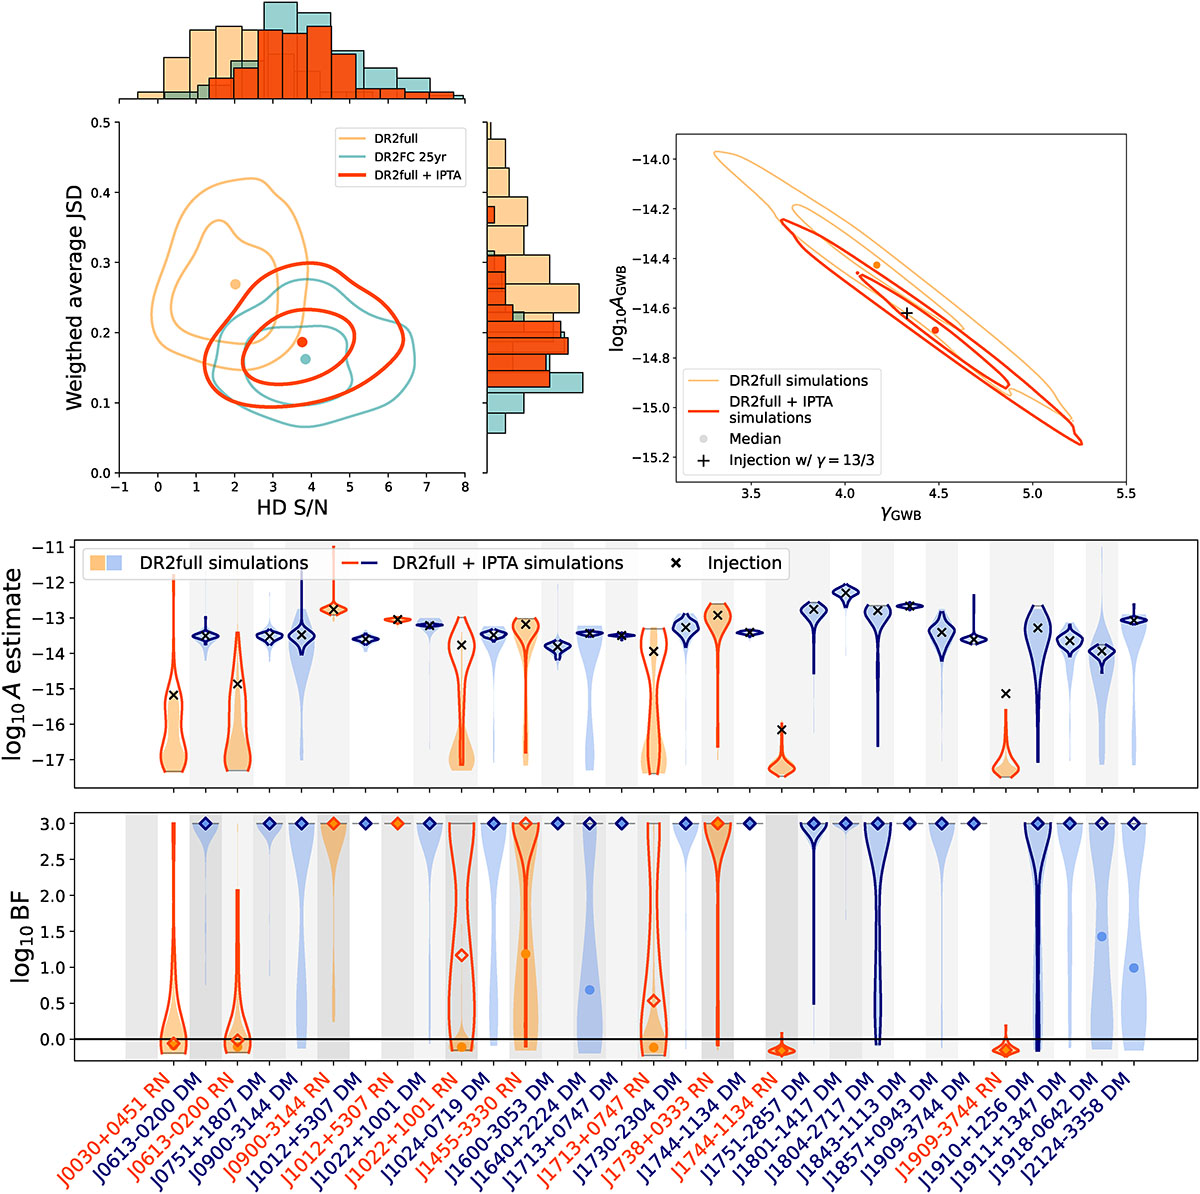
Fig. 7.
Download original image
GWB significance and parameter estimation from the 100 DR2full + IPTA simulations. Panel (a): 2D distributions of the noise marginalised HD S/N and the degeneracy coefficient (weighted average JSD). Panel (b): distribution of the median of log10AGWB and γGWB marginalised posterior distributions.. Panel (c): summary of the noise parameters estimation from the 100 realisations of DR2full (orange) and DR2full + IPTA (red) simulated data. Top: Median of the marginalised posterior distribution of the noise component amplitude, the true values are shown for reference (black crosses). Bottom: Savage-Dickey ratio of the amplitude posterior distributions; BF < 1 means the posterior is unconstrained, BF ≫1 means the posterior is very well constrained.
Current usage metrics show cumulative count of Article Views (full-text article views including HTML views, PDF and ePub downloads, according to the available data) and Abstracts Views on Vision4Press platform.
Data correspond to usage on the plateform after 2015. The current usage metrics is available 48-96 hours after online publication and is updated daily on week days.
Initial download of the metrics may take a while.