Fig. 8.
Download original image
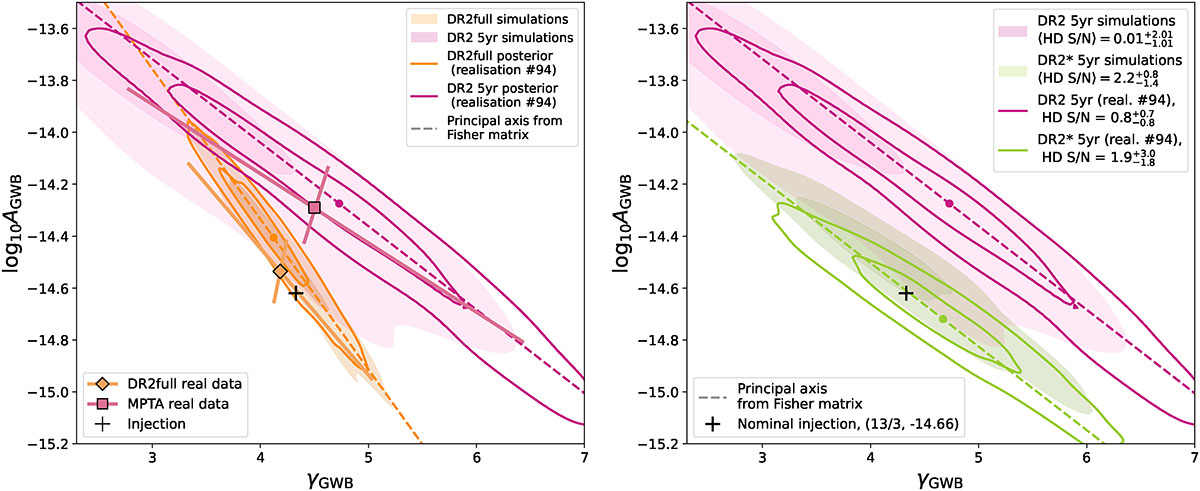
Median of the marginalised posterior distributions of γGWB and log10AGWB of all the 100 simulations (shaded region), posterior distribution of realisation 94 (solid line) and principal axis evaluated orientation evaluated from the Fisher matrix (dashed line). Panel (a): comparison between DR2full and DR2 5yr. For comparison, the principal axes of the real EPTA DR2full and MeerKAT PTA are also shown. Panel (b): comparison between DR2* 5yr and DR2 5yr. For reference, the injected value is displayed as a black cross.
Current usage metrics show cumulative count of Article Views (full-text article views including HTML views, PDF and ePub downloads, according to the available data) and Abstracts Views on Vision4Press platform.
Data correspond to usage on the plateform after 2015. The current usage metrics is available 48-96 hours after online publication and is updated daily on week days.
Initial download of the metrics may take a while.