Open Access
Fig. 13
Download original image
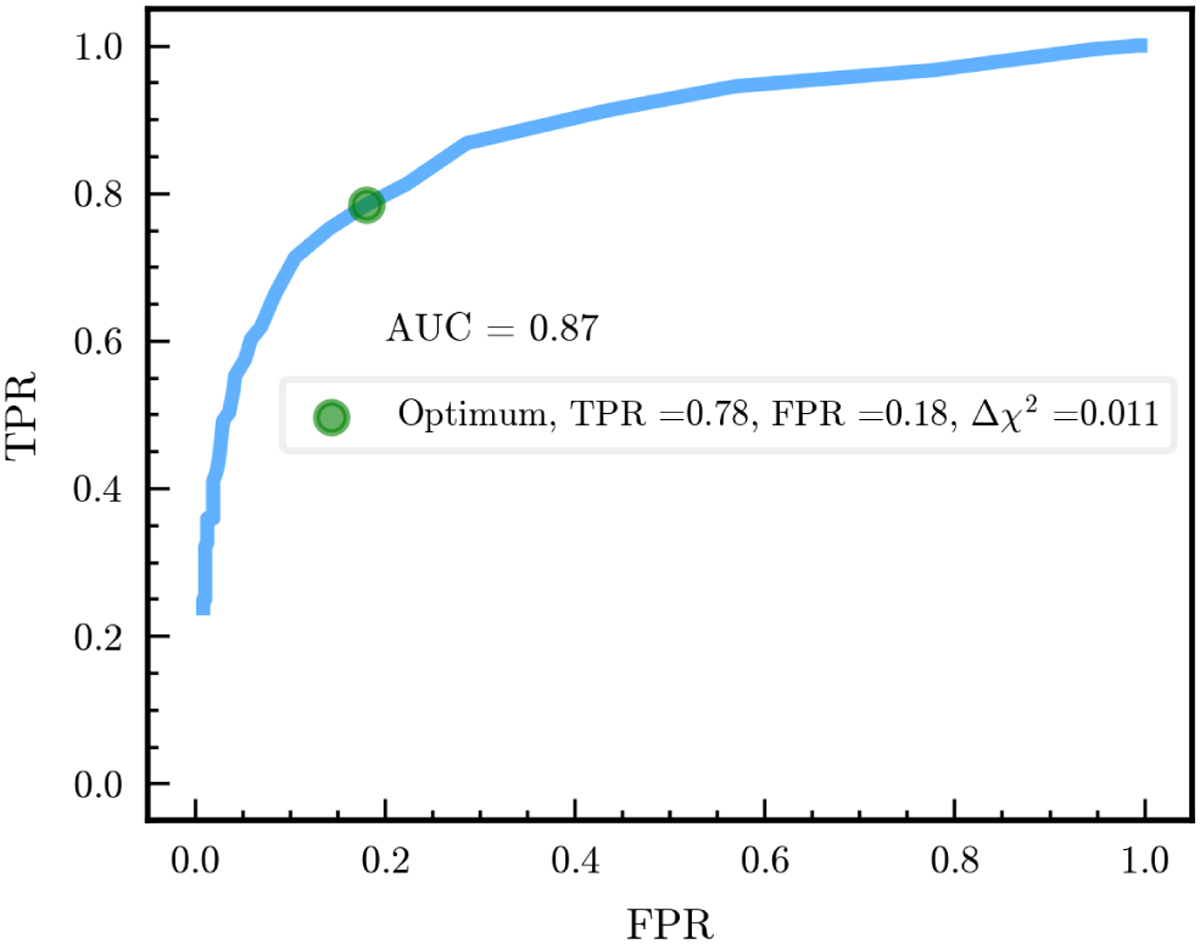
Deblending test ROC curve. The TPR versus the FPR is plotted as a blue line. The value of the AUC score is shown, and the optimal threshold is marked by the green point.
Current usage metrics show cumulative count of Article Views (full-text article views including HTML views, PDF and ePub downloads, according to the available data) and Abstracts Views on Vision4Press platform.
Data correspond to usage on the plateform after 2015. The current usage metrics is available 48-96 hours after online publication and is updated daily on week days.
Initial download of the metrics may take a while.