Fig. 5
Download original image
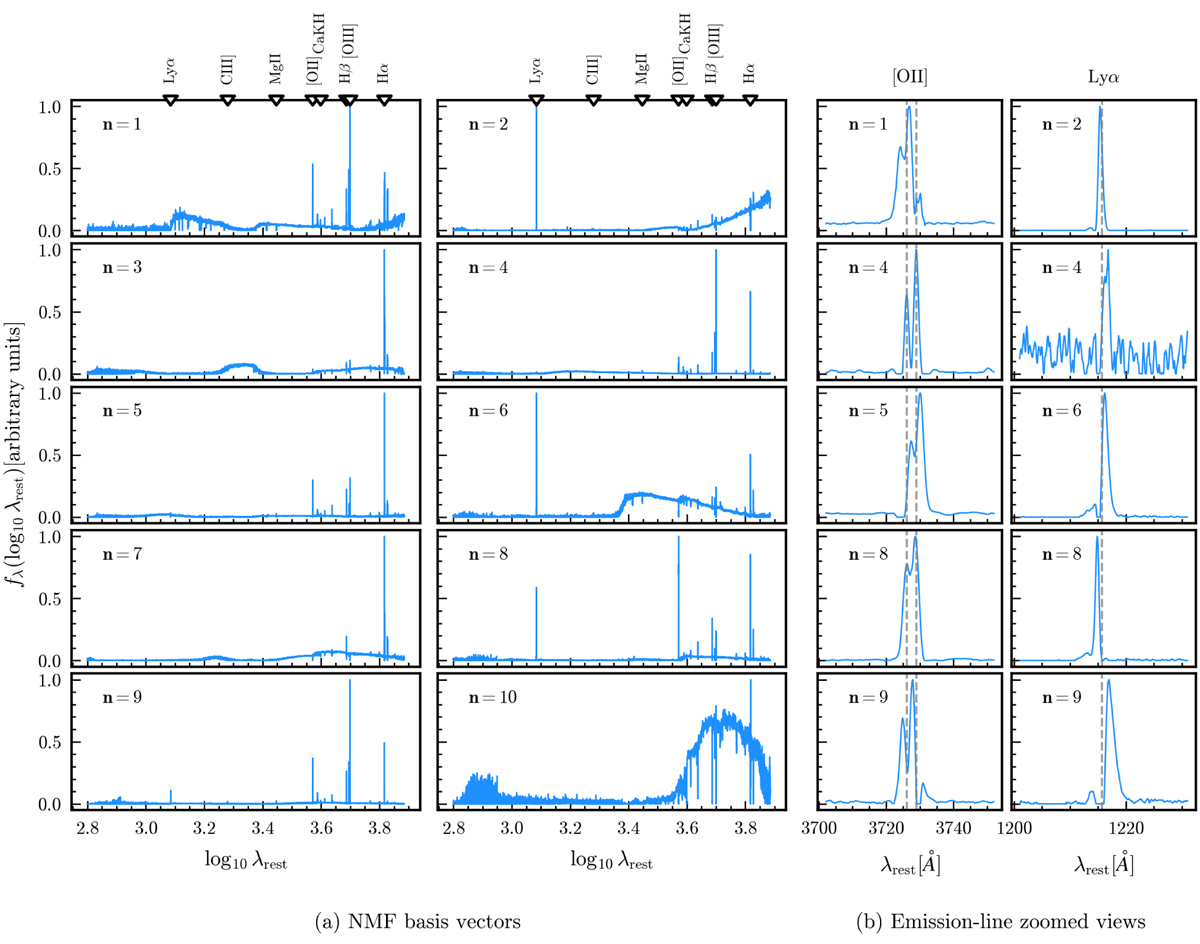
NMF-learned basis vectors. Panel a shows the basis vectors obtained from a sequential rank–10 NMF decomposition applied to 80% of the sample. The index n labels each basis vector. The names and rest-frame wavelengths of prominent spectral emission and absorption lines are indicated in the upper panels. Panel b presents zoomed-in views of the [O II] and Lyα emission lines, shown in the first and second columns, respectively. In each zoom-in, the line’s peak flux is normalized to one, the line rest wavelength is shown with a vertical dashed gray line, and the corresponding basis vector is indicated.
Current usage metrics show cumulative count of Article Views (full-text article views including HTML views, PDF and ePub downloads, according to the available data) and Abstracts Views on Vision4Press platform.
Data correspond to usage on the plateform after 2015. The current usage metrics is available 48-96 hours after online publication and is updated daily on week days.
Initial download of the metrics may take a while.