Fig. 2.
Download original image
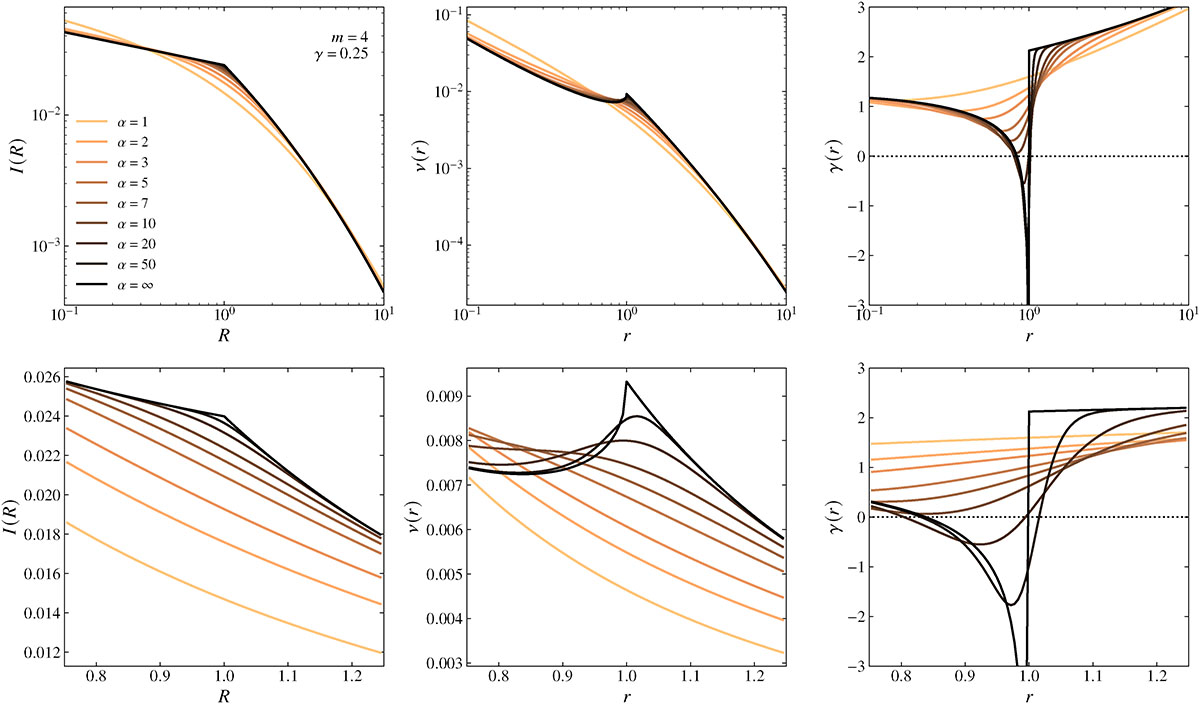
Intrinsic luminosity density profiles (left) and logarithmic density slopes γ(r) (right) for a sequence of core–Sérsic models with increasingly smooth transitions. All models share the same structural parameters as in Fig. 1, but the transition parameter α takes the values α = 4, 2, 1, 0.5, 0.25, and 0.1, as indicated. Large values of α produce a strong peak in the intrinsic density just outside the break radius, reflecting the discontinuity in the derivative of the projected profile. As the transition becomes smoother (smaller α), this peak gradually diminishes and shifts outwards, and the region with negative logarithmic slope γ(r) shrinks. For sufficiently small α, the density profile becomes fully monotonic and physically admissible. The comparison illustrates that the transition parameter, rather than the inner or outer slopes themselves, primarily determines whether a core–Sérsic model yields a realistic three-dimensional stellar density distribution.
Current usage metrics show cumulative count of Article Views (full-text article views including HTML views, PDF and ePub downloads, according to the available data) and Abstracts Views on Vision4Press platform.
Data correspond to usage on the plateform after 2015. The current usage metrics is available 48-96 hours after online publication and is updated daily on week days.
Initial download of the metrics may take a while.