Fig. 3.
Download original image
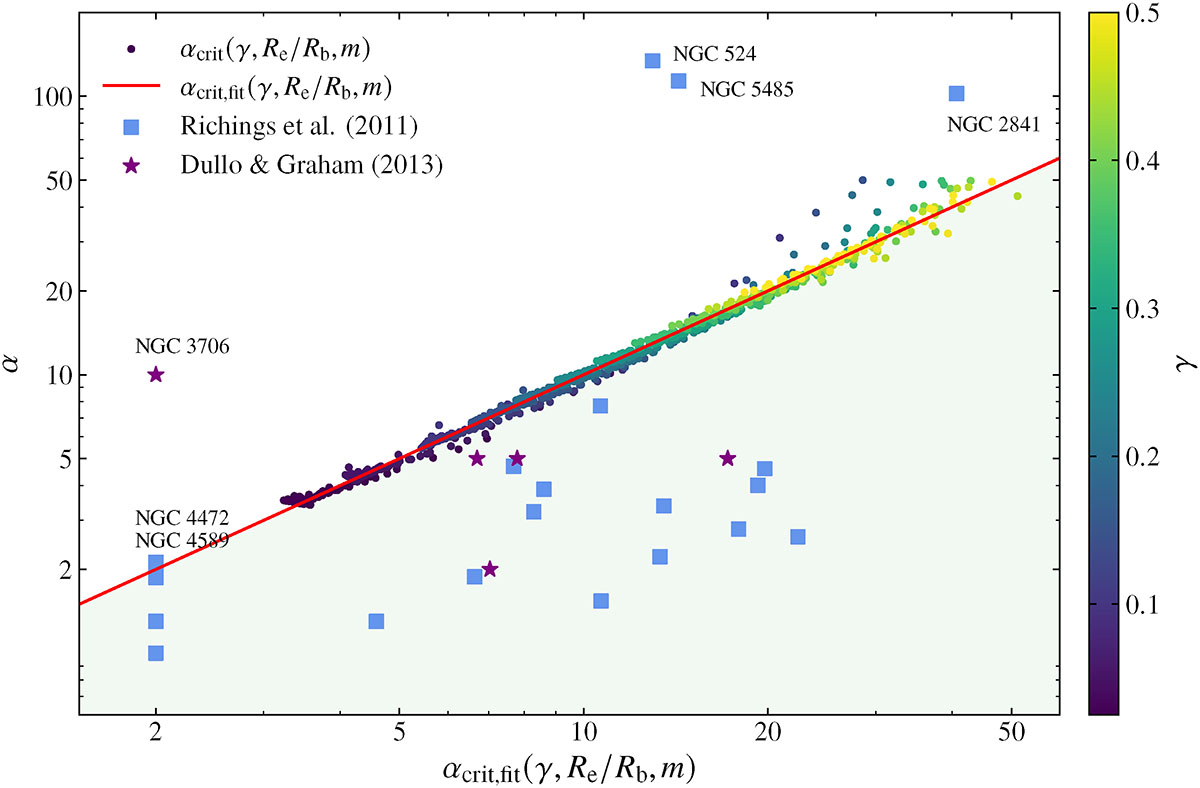
Comparison between the transition parameter, α, and the critical value, αcrit(γ, Re/Rb, m), that separates physically admissible and inadmissible core–Sérsic models. The horizontal axis shows the fitted approximation αcrit, fit(γ, Re/Rb, m), while the vertical axis shows the actual transition parameter, α. The red line indicates the boundary α = αcrit: models below this line have monotonically decreasing intrinsic density profiles and are therefore physically admissible, whereas models above the line produce non-monotonic densities and are unphysical. The colour scale indicates the inner logarithmic slope, γ. Overplotted are core–Sérsic parameters from the observational studies of Richings et al. (2011, blue squares) and Dullo & Graham (2013, violet stars), illustrating that most observed systems lie within the physically allowed region, while a few fall in the inadmissible part of the parameter space.
Current usage metrics show cumulative count of Article Views (full-text article views including HTML views, PDF and ePub downloads, according to the available data) and Abstracts Views on Vision4Press platform.
Data correspond to usage on the plateform after 2015. The current usage metrics is available 48-96 hours after online publication and is updated daily on week days.
Initial download of the metrics may take a while.