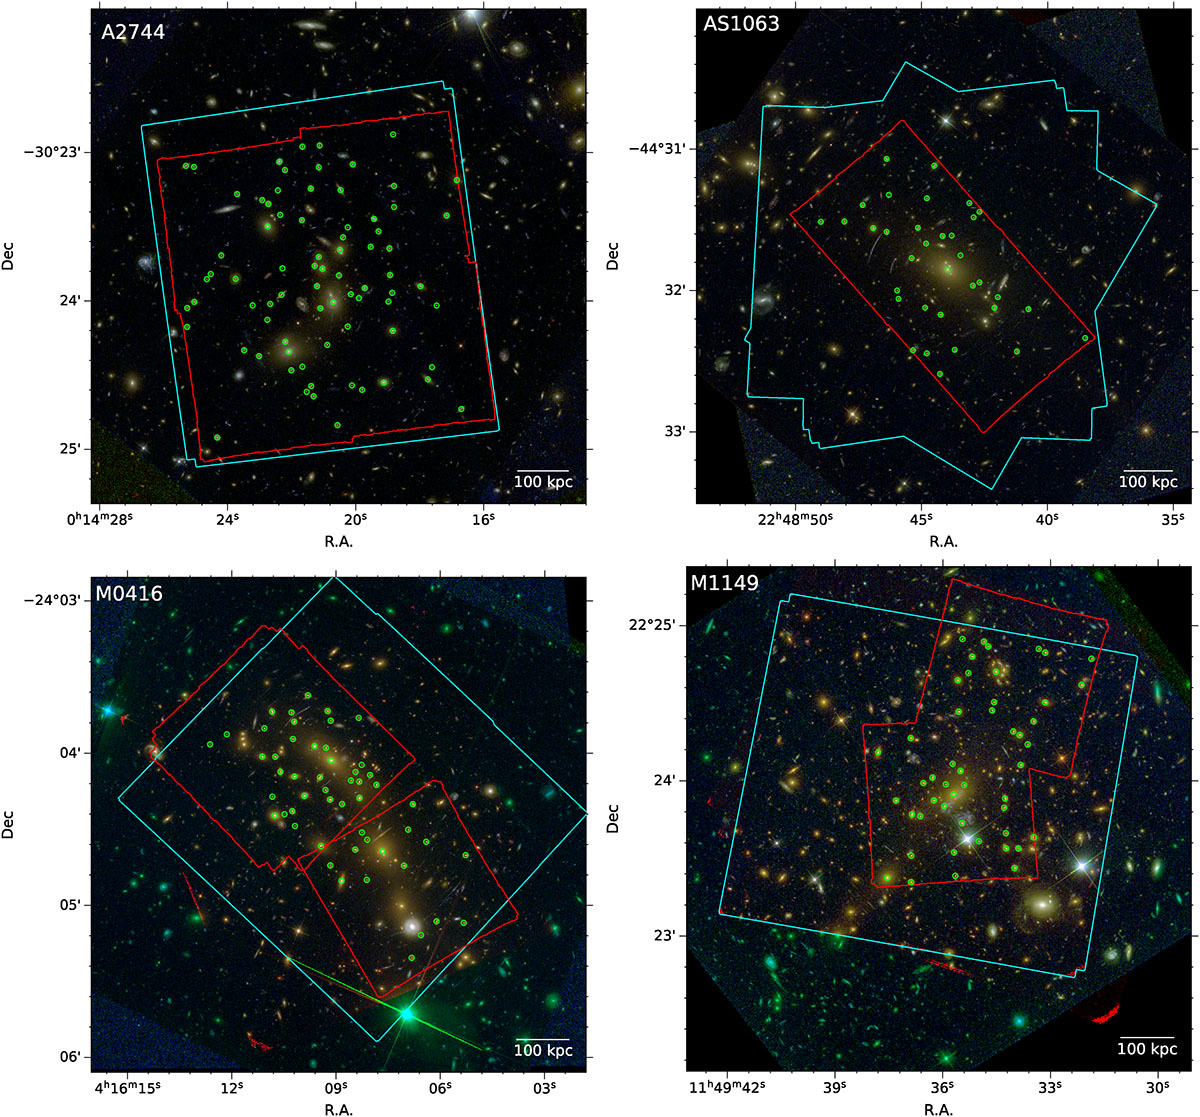
Fig. 1.
Download original image
RGB images of the cores of the four clusters from HFF photometry. The red, green, and blue channels were obtained by combining the filters F105W + F125W + F140W + F160W, F606W + F814W, and F435W, respectively. We show the FoV of the MUSE observations with red contours, and we mark all the cluster members for which we have measured a velocity dispersion value with green circles. Finally, we show the region intersection of all HFF bands for each cluster with cyan contours.
Current usage metrics show cumulative count of Article Views (full-text article views including HTML views, PDF and ePub downloads, according to the available data) and Abstracts Views on Vision4Press platform.
Data correspond to usage on the plateform after 2015. The current usage metrics is available 48-96 hours after online publication and is updated daily on week days.
Initial download of the metrics may take a while.