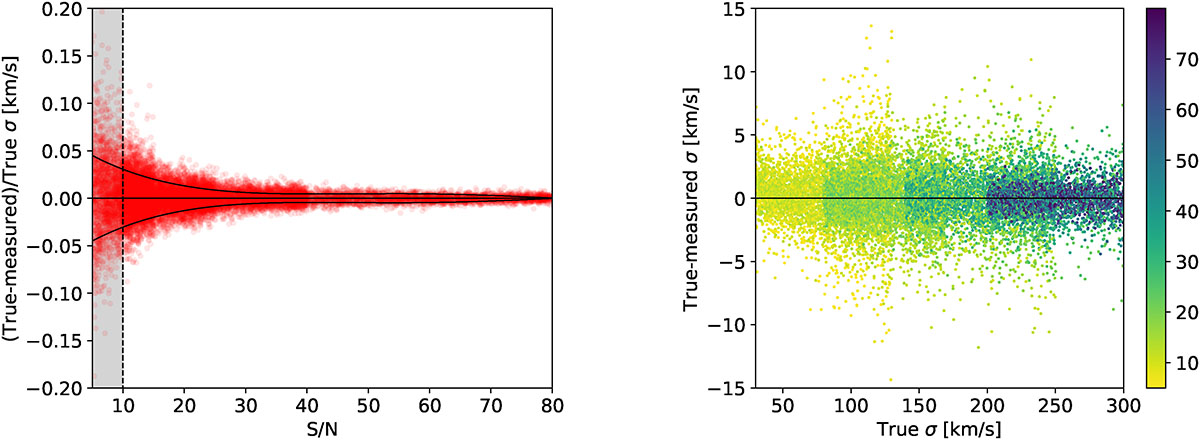
Fig. A.2.
Download original image
Velocity dispersion measurements for simulated spectra. Left panel: Relative offset of the recovered velocity dispersion with respect to the true value as a function of the S/N. We show the median relative uncertainty from Eq. (A.1) as a black line. Right panel: Absolute offset between the recovered and the true velocity dispersion values as a function of the input velocity dispersion. The points are colour-coded by the corresponding spectral S/N.
Current usage metrics show cumulative count of Article Views (full-text article views including HTML views, PDF and ePub downloads, according to the available data) and Abstracts Views on Vision4Press platform.
Data correspond to usage on the plateform after 2015. The current usage metrics is available 48-96 hours after online publication and is updated daily on week days.
Initial download of the metrics may take a while.