Fig. 3
Download original image
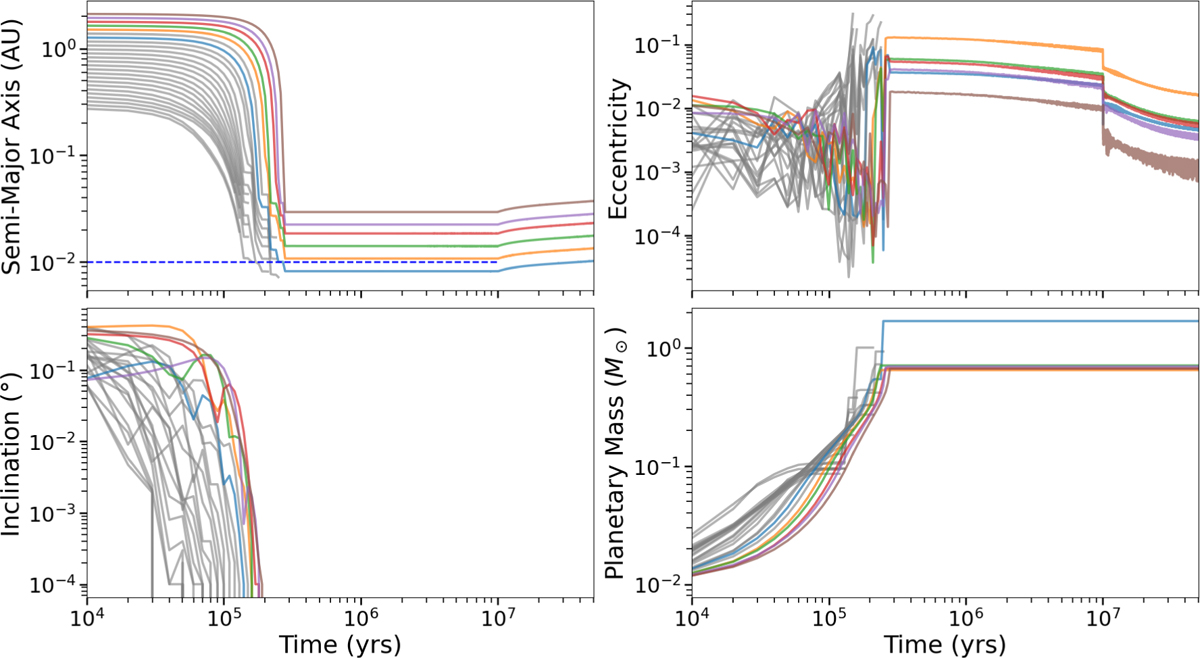
Dynamical evolution of planetary embryos in a representative simulation of Scenario FIX. Each line corresponds to one embryo: gray lines show all embryos, while colored lines highlight those that survive until the end of the integration at ∼50 Myr. Panels display the semimajor axis (top left), eccentricity (top right), inclination (bottom left), and planetary mass (bottom right). The horizontal dashed blue line in the semimajor-axis panel marks the fixed inner disk edge at 0.01 au, which is applied only during the gas-disk phase (up to 10 Myr).
Current usage metrics show cumulative count of Article Views (full-text article views including HTML views, PDF and ePub downloads, according to the available data) and Abstracts Views on Vision4Press platform.
Data correspond to usage on the plateform after 2015. The current usage metrics is available 48-96 hours after online publication and is updated daily on week days.
Initial download of the metrics may take a while.