Fig. 9
Download original image
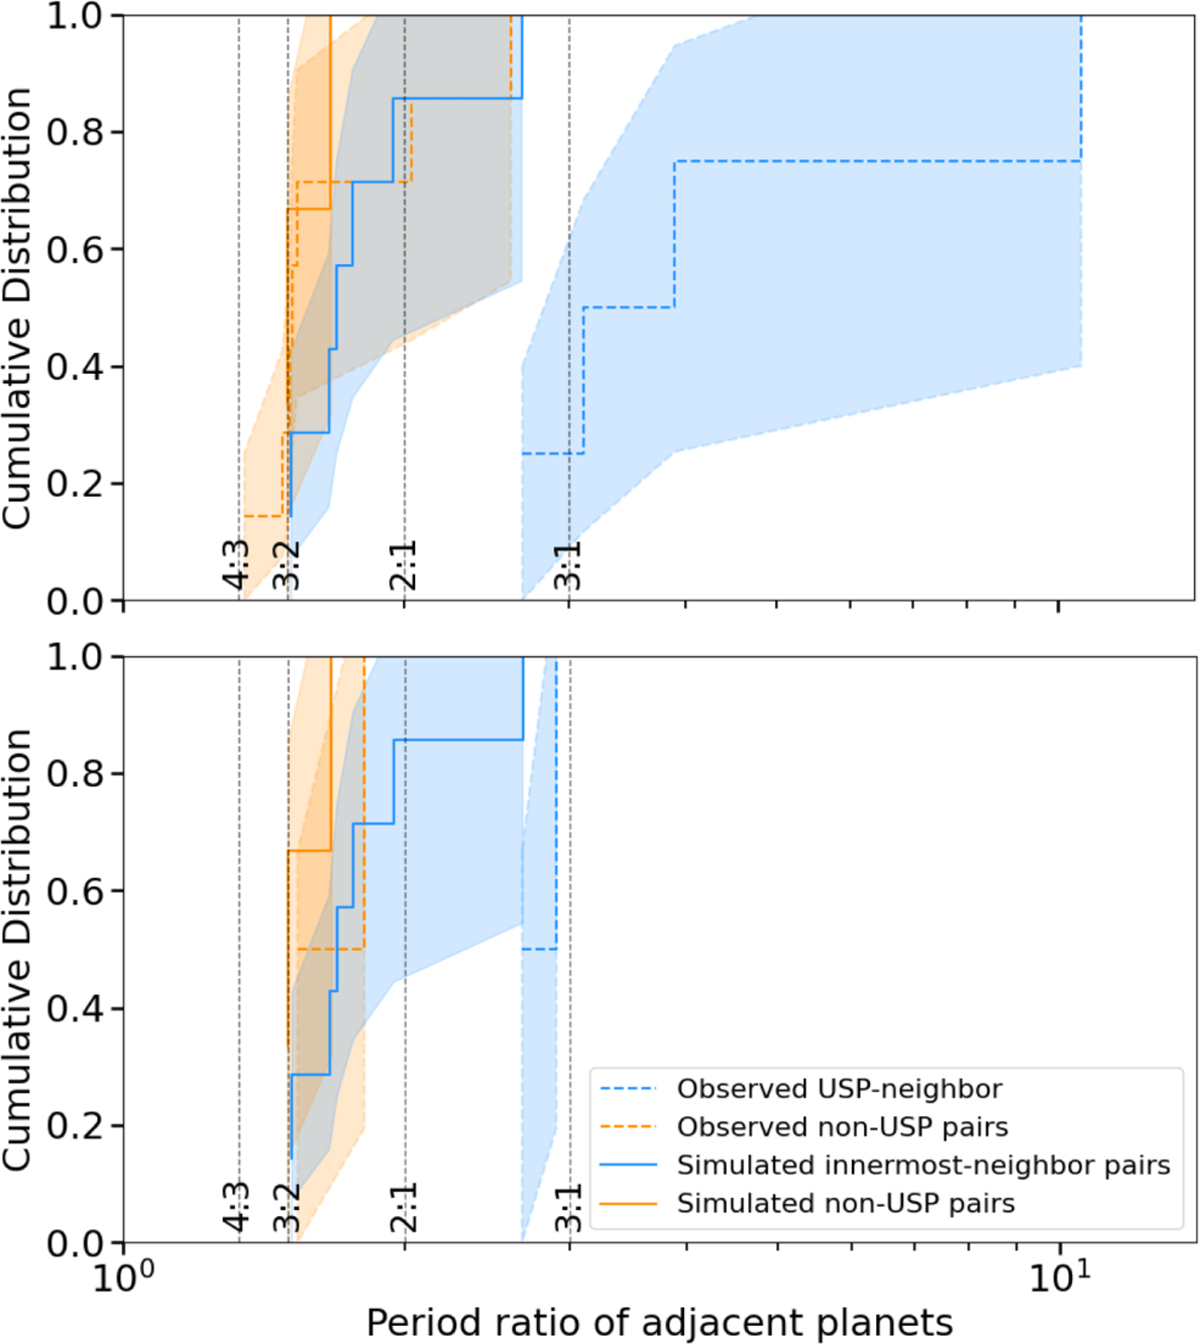
Cumulative distributions of adjacent period ratios. Simulated systems in Scenario IN[C] at 50 Myr (solid lines) with detection probabilities associated with TESS higher than 0.9 (see Fig. 8). Observed exoplanetary systems around stars with masses 0.08 < M*/M⊙ < 0.6 (top panel) and around stars with masses 0.08 < M*/M⊙ < 0.35 (bottom panel) that host a USP planet (dashed lines). Observed USP-neighbor pairs are compared to simulated USP + candidate neighbors (blue lines). Other adjacent pairs around M dwarfs are compared to all other adjacent pairs in our simulations (orange lines). Vertical dotted lines mark common MMRs: 4:3, 3:2, 2:1, and 3:1. Poissonian errors for each distribution are shown as shadow areas. The comparison tests whether the early-epoch orbital spacing of prospective USPs resembles the presentday spacing observed for mature USP systems.
Current usage metrics show cumulative count of Article Views (full-text article views including HTML views, PDF and ePub downloads, according to the available data) and Abstracts Views on Vision4Press platform.
Data correspond to usage on the plateform after 2015. The current usage metrics is available 48-96 hours after online publication and is updated daily on week days.
Initial download of the metrics may take a while.