Fig. 7.
Download original image
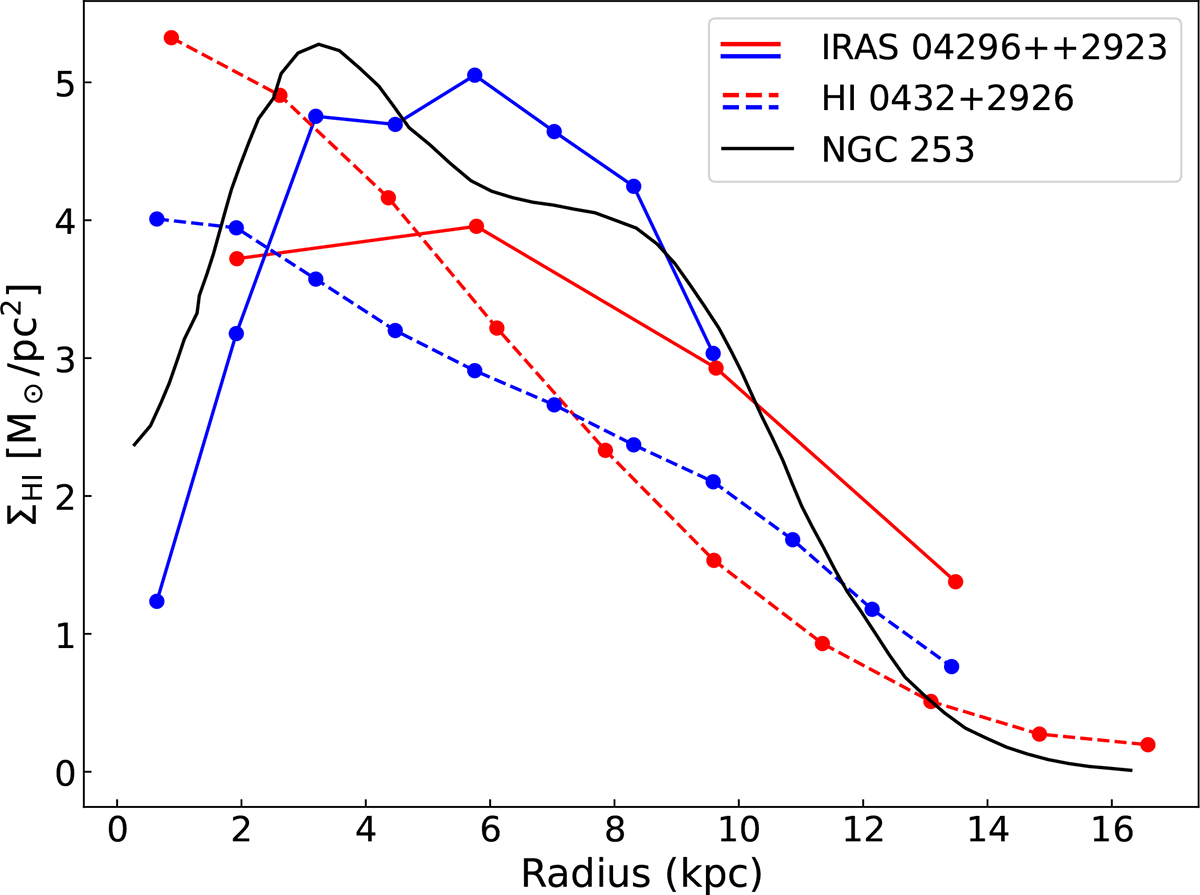
Radial H I surface density profiles of IRAS 04296+2923 and H I 0432+2926. For each galaxy, the profiles derived from the VLA–D and VLA–C configurations are shown in red and blue, respectively, with solid lines representing IRAS 04296+2923 and dashed lines representing H I 0432+2926. For comparison, the H I radial profile of NGC 253 from the KAT-7 observations (Lucero et al. 2015) is plotted as the solid black line.
Current usage metrics show cumulative count of Article Views (full-text article views including HTML views, PDF and ePub downloads, according to the available data) and Abstracts Views on Vision4Press platform.
Data correspond to usage on the plateform after 2015. The current usage metrics is available 48-96 hours after online publication and is updated daily on week days.
Initial download of the metrics may take a while.