Fig. 1.
Download original image
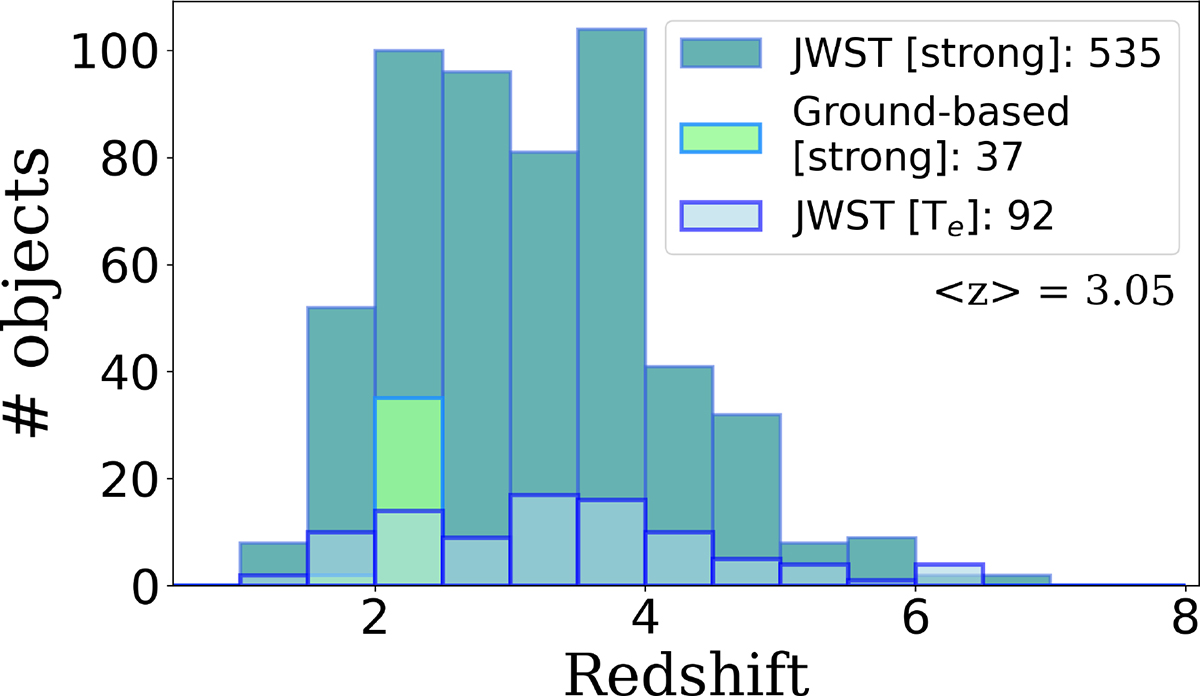
Redshift distribution of 664 galaxies for which we measured O/H and N/O in the high-z sample. JWST galaxies with auroral-line detections are shown in light blue; JWST objects without auroral-line detections (strong-line measurements only) are displayed in teal; objects from ground-based surveys (strong-line measurements from MOSDEF and KLEVER) are plotted in green.
Current usage metrics show cumulative count of Article Views (full-text article views including HTML views, PDF and ePub downloads, according to the available data) and Abstracts Views on Vision4Press platform.
Data correspond to usage on the plateform after 2015. The current usage metrics is available 48-96 hours after online publication and is updated daily on week days.
Initial download of the metrics may take a while.