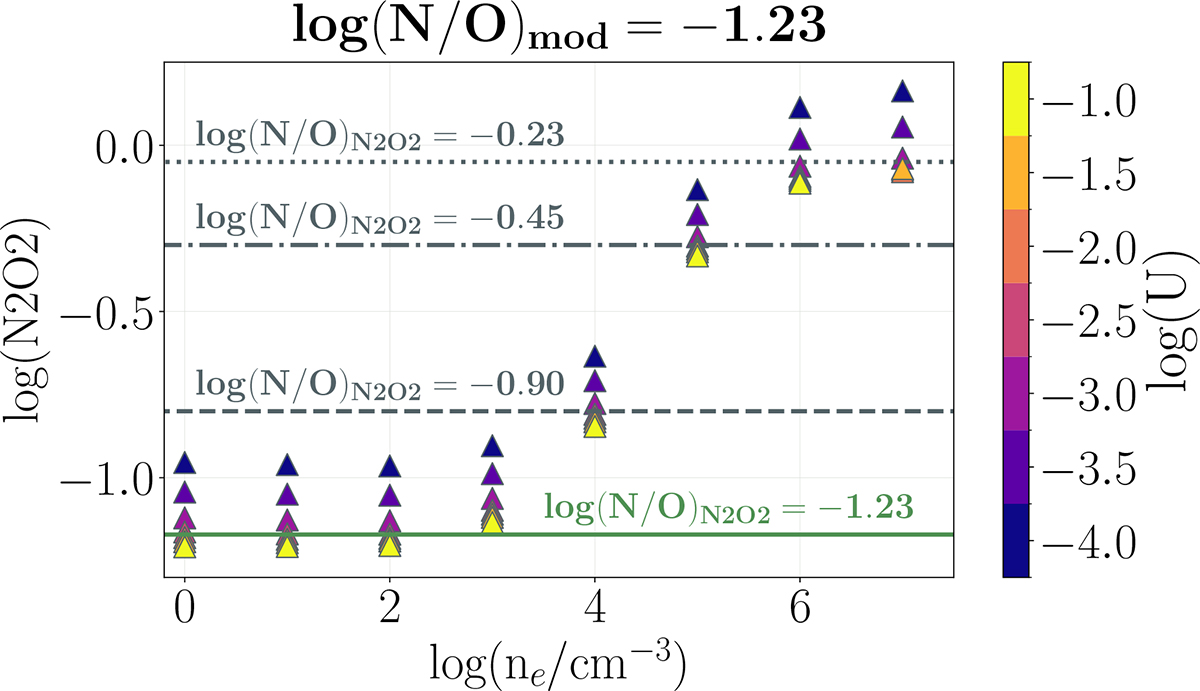
Fig. D.2.
Download original image
N2O2 as a function of density for the CLOUDY models described in Appendix D (triangles), colour-coded by the ionisation parameter log(U). The green solid line shows the N2O2 value corresponding to the model N/O using the calibration 3. The grey dashed, dot-dashed, and dotted lines indicate the N/O that would be inferred from the calibration at those specific N2O2. While our calibration performs well at densities ≤103 cm−3, it overestimates N/O at higher gas densities, as expected.
Current usage metrics show cumulative count of Article Views (full-text article views including HTML views, PDF and ePub downloads, according to the available data) and Abstracts Views on Vision4Press platform.
Data correspond to usage on the plateform after 2015. The current usage metrics is available 48-96 hours after online publication and is updated daily on week days.
Initial download of the metrics may take a while.