Fig. 4.
Download original image
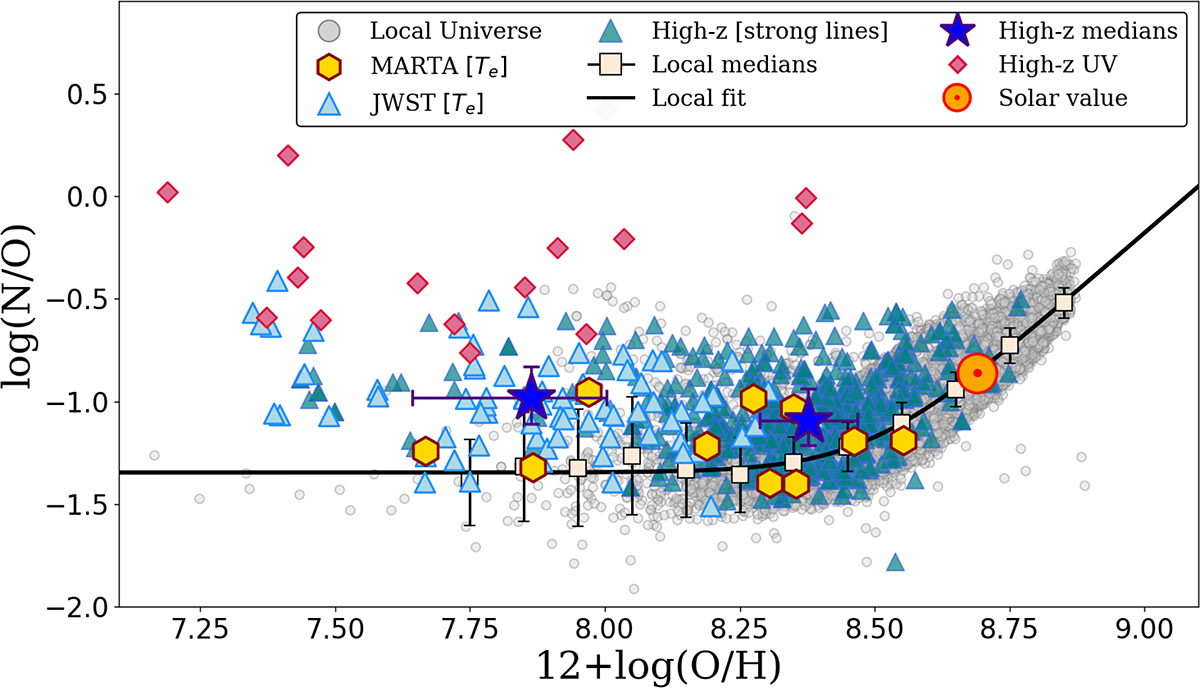
Relation between N/O and O/H for our full sample, as described in Section 2. Gold hexagons indicate MARTA galaxies with direct measurements, and light blue triangles show the JWST auroral-line dataset. High-redshift strong-line galaxies from the literature are plotted as teal triangles, and local galaxies (both direct and strong-line measurements) are shown as grey circles. White squares represent local galaxies binned in metallicity, showing the median N/O value in each bin. Two large blue stars indicate the median N/O values for high-redshift galaxies, with the first corresponding to 12 + log(O/H) < 8.1 and the second to 12 + log(O/H)≥8.1. The black line shows the best-fit relation derived from the binned values of local galaxies using the functional form from Hayden-Pawson et al. (2022), with the best-fit parameters obtained in this work and reported in Table 1. The solar abundance values from Asplund et al. (2021) are shown with the orange Sun symbol. Finally, the pink diamonds represent higher redshift, UV-based abundances drawn from the recent compilation by Ji et al. (2026). These sources are shown to illustrate the respective loci occupied by optical-based and UV-based abundances in this parameter space.
Current usage metrics show cumulative count of Article Views (full-text article views including HTML views, PDF and ePub downloads, according to the available data) and Abstracts Views on Vision4Press platform.
Data correspond to usage on the plateform after 2015. The current usage metrics is available 48-96 hours after online publication and is updated daily on week days.
Initial download of the metrics may take a while.