Fig. 6.
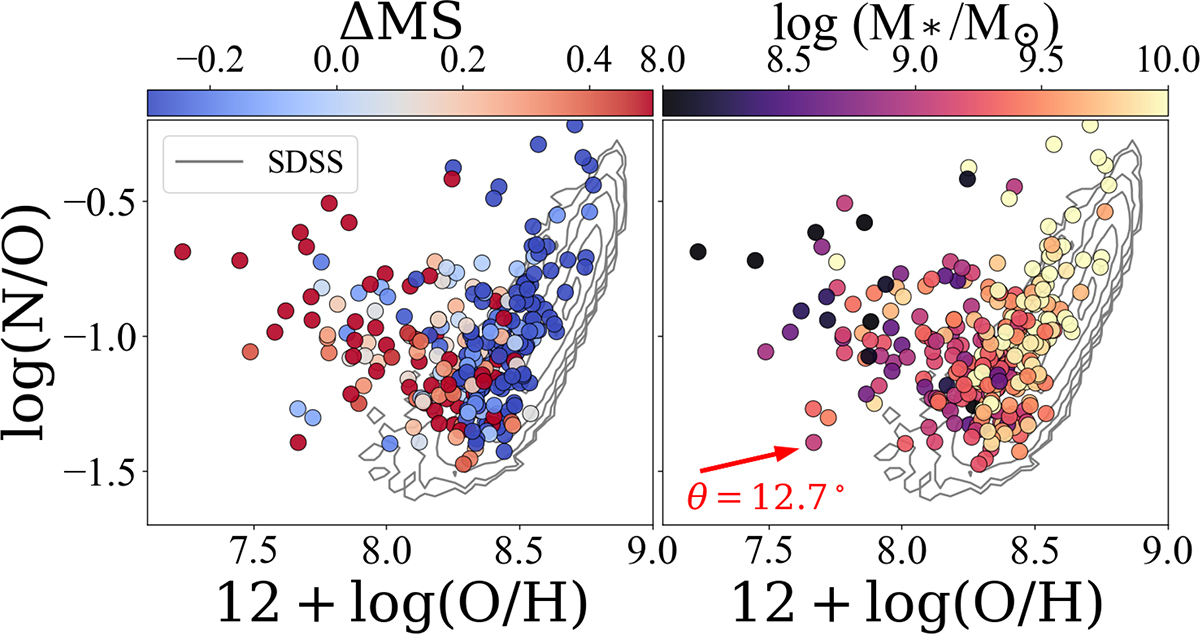
Download original image
Same as Figure 4, but with the SDSS density contours as the sole local reference for simplicity. The high-z sample is represented with circles, with no distinction between different datasets. Left panel: High-z sample colour-coded by ΔMS, i.e. the deviation from the parametrised SFMS from Popesso et al. (2023), computed at each specific redshift. Right panel: High-z sample colour-coded by stellar mass. The gradient angle of the M* trend within the plane is shown as a red arrow, visually representing the finding that N-enhanced galaxies are preferentially associated with lower stellar masses.
Current usage metrics show cumulative count of Article Views (full-text article views including HTML views, PDF and ePub downloads, according to the available data) and Abstracts Views on Vision4Press platform.
Data correspond to usage on the plateform after 2015. The current usage metrics is available 48-96 hours after online publication and is updated daily on week days.
Initial download of the metrics may take a while.