Fig. 1.
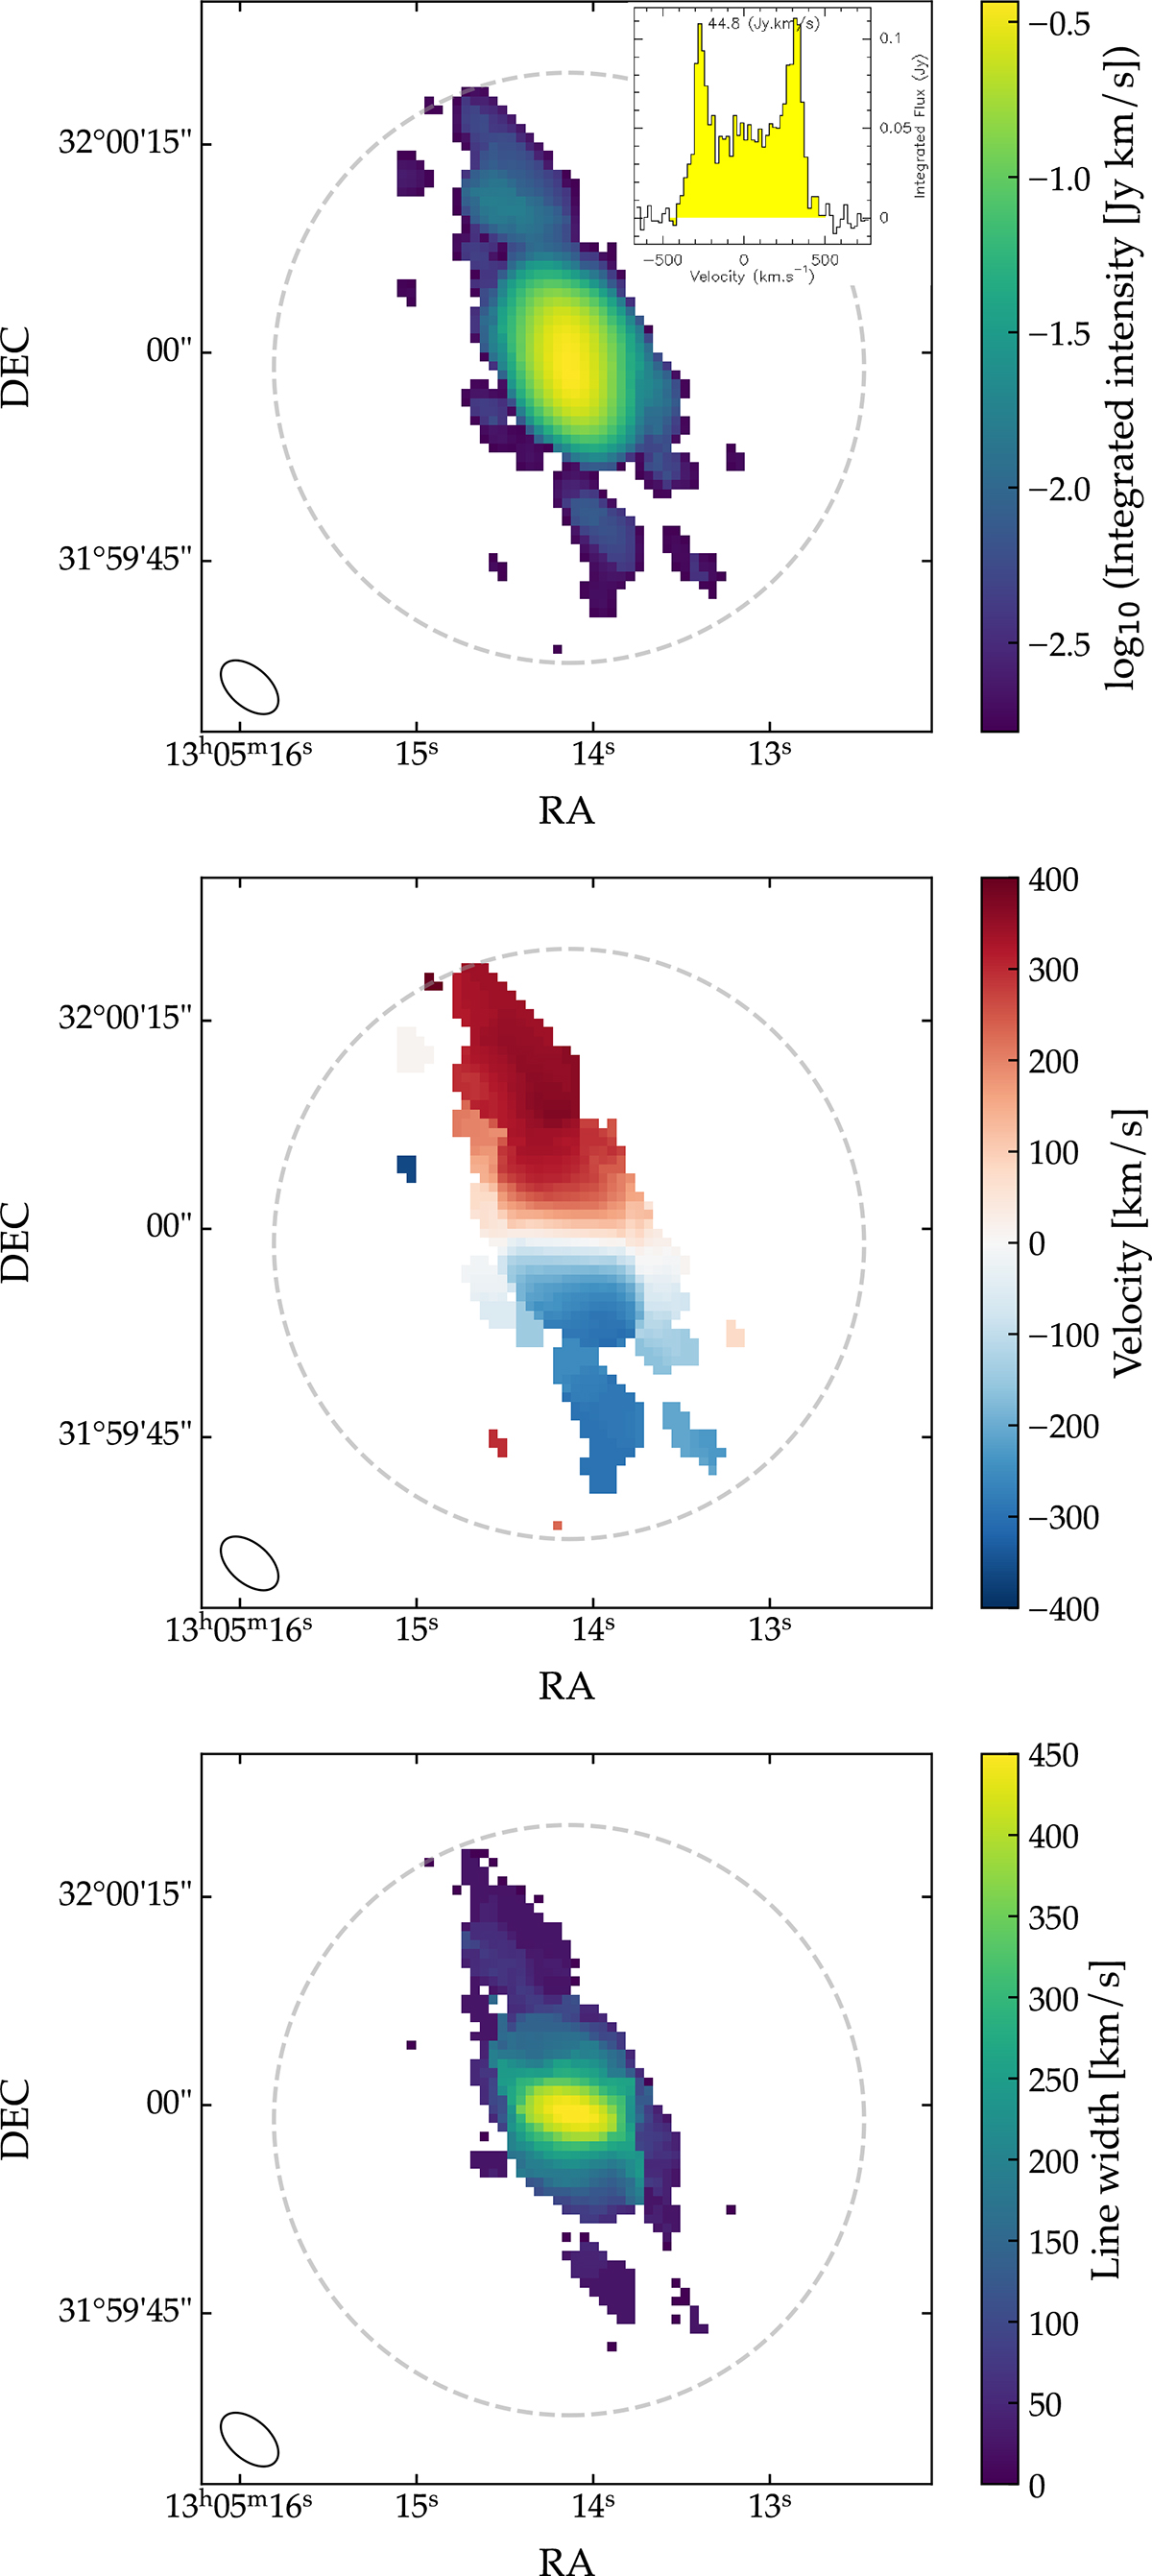
Download original image
CO(1-0) moment maps from the cleaned data cube. Top: Moment-0 in log10 (integrated line intensity). Insert: Integrated spectrum at 20 km/s resolution over the region where CO reaches significant S/N. Middle: Moment-1 (Vlos, intensity-weighted velocity). Bottom: Moment-2 (line width). The dashed gray circle represents the NOEMA HPBW at the redshifted CO(1-0) frequency. The ellipse at the bottom right corner is the synthesized beam (4.9″ × 2.9″).
Current usage metrics show cumulative count of Article Views (full-text article views including HTML views, PDF and ePub downloads, according to the available data) and Abstracts Views on Vision4Press platform.
Data correspond to usage on the plateform after 2015. The current usage metrics is available 48-96 hours after online publication and is updated daily on week days.
Initial download of the metrics may take a while.