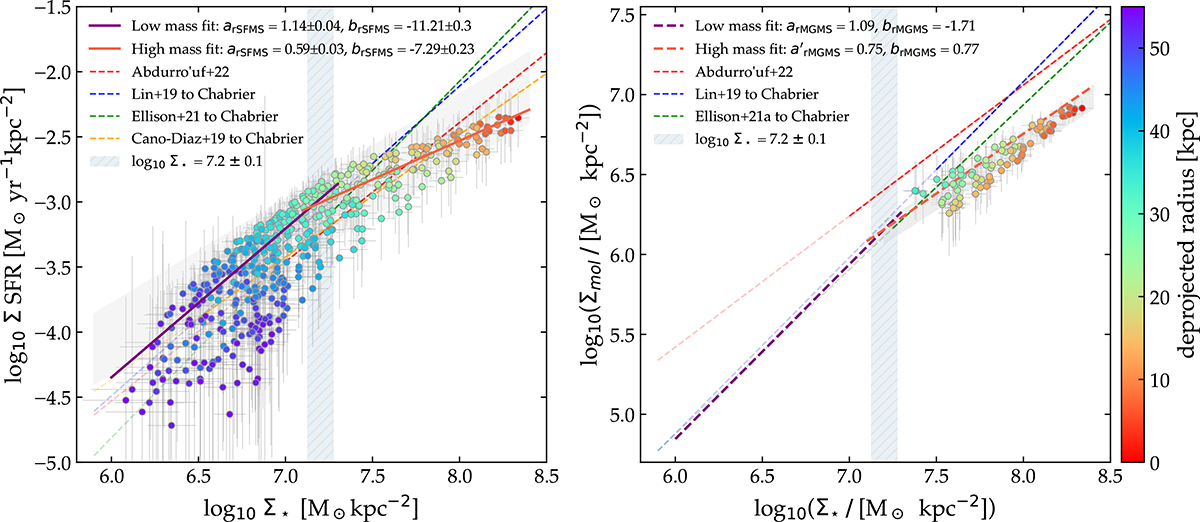
Fig. D.1.
Download original image
Left: Resolved SFMS with two linear fits for high- and low-mass regimes respectively drawn as orange and purple solid lines. The hatched region corresponds to the range of values contributing both to the high- and low-mass ODR fits. The shaded area represents the scatter of the sole linear fit from the left panel of Fig. 7. Right: Resolved MGMS with the two linear predictions from the opposite SFMS fits represented by the dotted orange and purple lines for the high- and low-mass regimes. The dotted purple line is a prediction of the rMGMS at low surface densities, below the molecular-to-atomic phase transition. The shaded area represents the scatter of the sole linear fit from the right panel of Fig. 7. The rest of the legend in both panels is identical to the left and right-hand panels of Fig. 7.
Current usage metrics show cumulative count of Article Views (full-text article views including HTML views, PDF and ePub downloads, according to the available data) and Abstracts Views on Vision4Press platform.
Data correspond to usage on the plateform after 2015. The current usage metrics is available 48-96 hours after online publication and is updated daily on week days.
Initial download of the metrics may take a while.