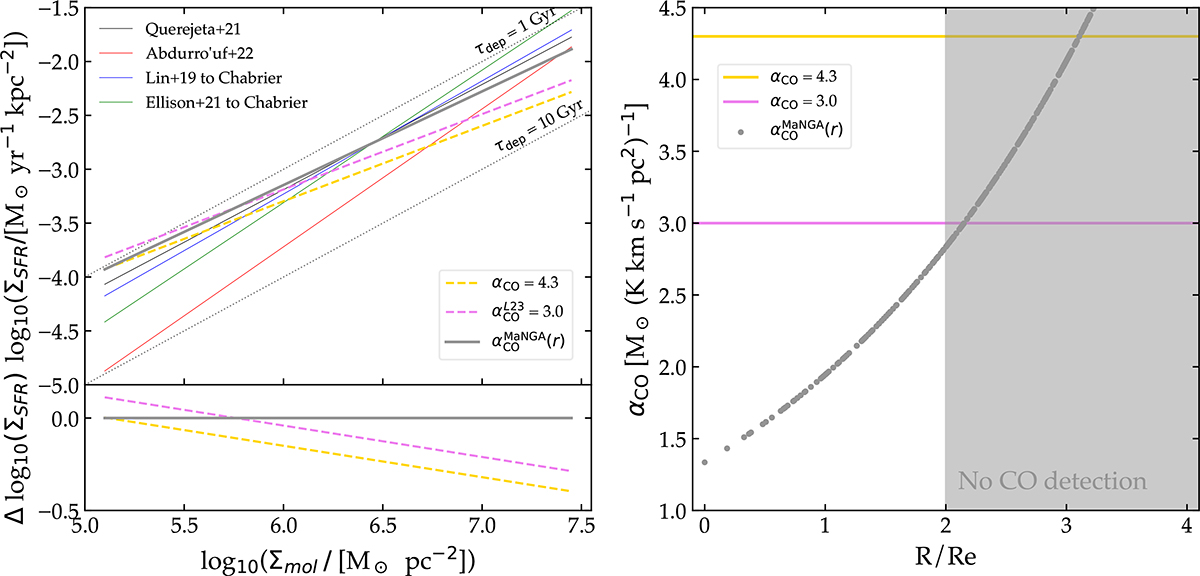
Fig. F.1.
Download original image
Top left: Resolved Kennicutt-Schmidt relation with varying αCO. The thick solid gray line corresponds to the ODR fit in the middle panel of Fig. 7, using a metallicity-dependent αCOMaNGA. The dashed pink (yellow) line represents the fit to the data computed using a constant αCO = 3.0 (4.3). The corresponding data points to each linear fit are only the unhatched pixels above the 4σ detection threshold. Bottom left: Residuals with respect to the results shown in Sec. 4, with αCOMaNGA. Right: Radial profiles of αCO for the three prescriptions.
Current usage metrics show cumulative count of Article Views (full-text article views including HTML views, PDF and ePub downloads, according to the available data) and Abstracts Views on Vision4Press platform.
Data correspond to usage on the plateform after 2015. The current usage metrics is available 48-96 hours after online publication and is updated daily on week days.
Initial download of the metrics may take a while.