Fig. 2.
Download original image
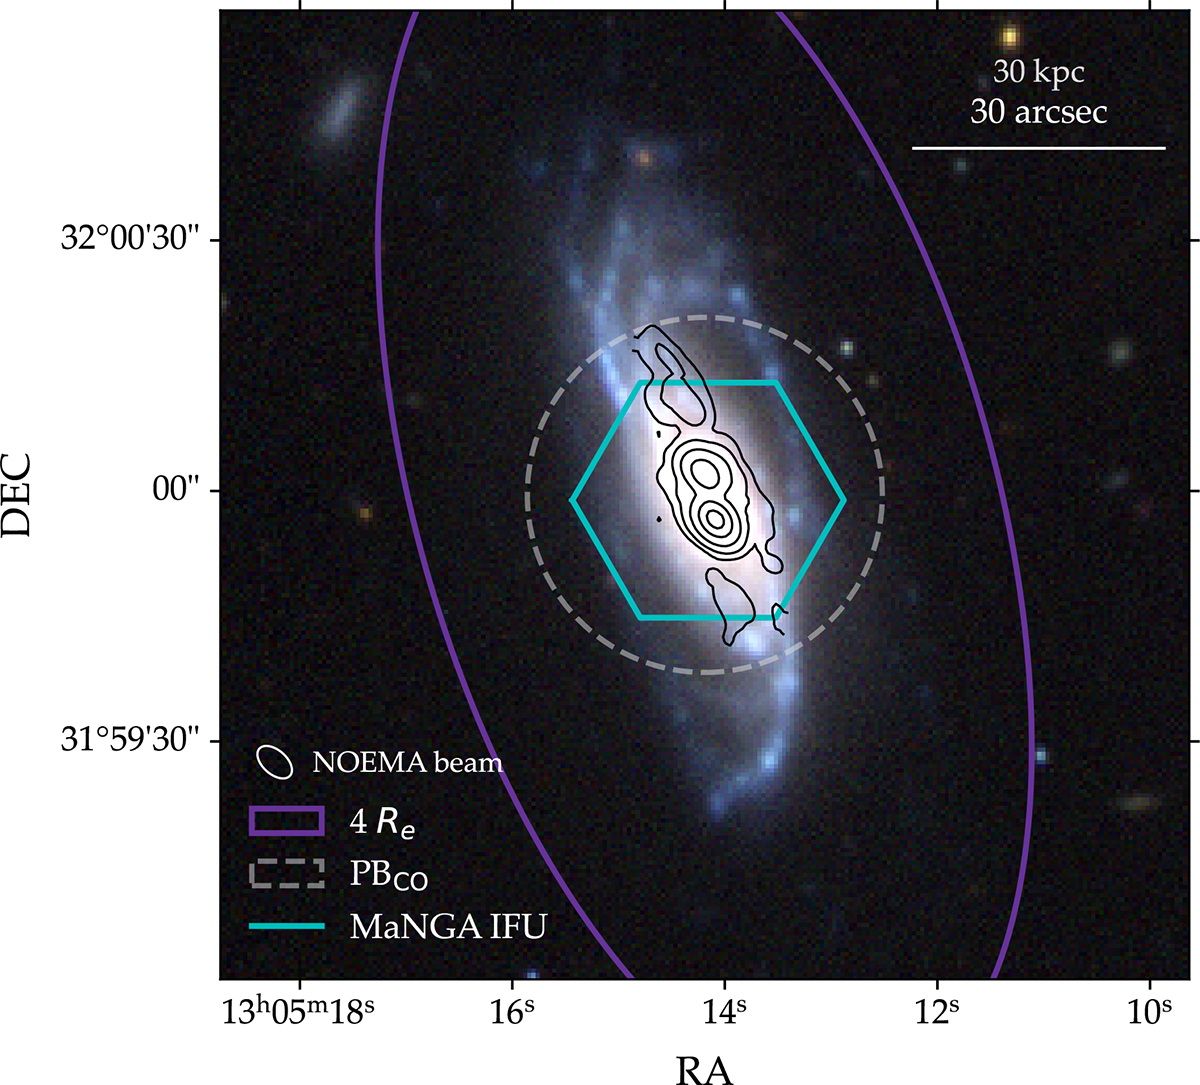
Distribution of CO(1-0) maxima from NOEMA data on a background optical image from the DESI Legacy Survey (DR9). The contour levels are [4.5, 9, 20, 40, 60] mJy beam−1. The dashed gray circle represents the NOEMA HPBW size at the CO(1-0) redshifted frequency, while the purple ellipse indicates the semimajor axis of 4 Re. The white ellipse at the bottom left corner is the synthesized beam of NOEMA (4.9″ × 2.9″).
Current usage metrics show cumulative count of Article Views (full-text article views including HTML views, PDF and ePub downloads, according to the available data) and Abstracts Views on Vision4Press platform.
Data correspond to usage on the plateform after 2015. The current usage metrics is available 48-96 hours after online publication and is updated daily on week days.
Initial download of the metrics may take a while.