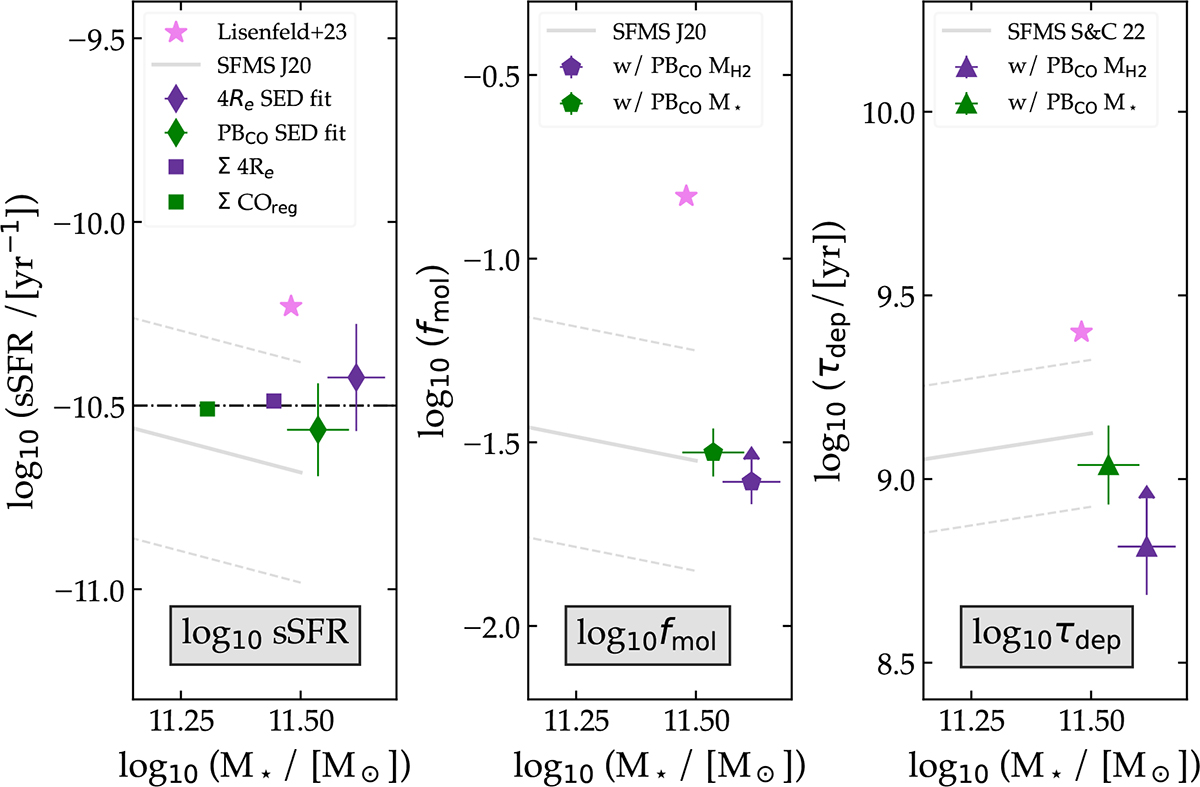
Fig. 3.
Download original image
Left: Log sSFR100 with respect to M★. The green (purple) diamond and square denote the integrated fit and the sum of the resolved fits in the PBCO (4 Re) region, respectively. The SFMS from Janowiecki et al. (2020) is included for comparison. The dash-dotted black line shows a constant log sSFR100 = −10.5 and serves as a visual guide. Middle: Molecular gas mass fraction with respect to M★. The purple pentagon represents the large-scale lower limit of fmol. The SFMS is also from Janowiecki et al. (2020). The green pentagon corresponds to the fmol in the PBCO region only. Right: Molecular gas depletion time with respect to M★. The solid gray line is the linear fit for SMFS galaxies from Saintonge & Catinella (2022), with a 0.2 dex scatter. The rest of the legend is identical to the middle panel, with triangles instead of pentagons.
Current usage metrics show cumulative count of Article Views (full-text article views including HTML views, PDF and ePub downloads, according to the available data) and Abstracts Views on Vision4Press platform.
Data correspond to usage on the plateform after 2015. The current usage metrics is available 48-96 hours after online publication and is updated daily on week days.
Initial download of the metrics may take a while.