Open Access
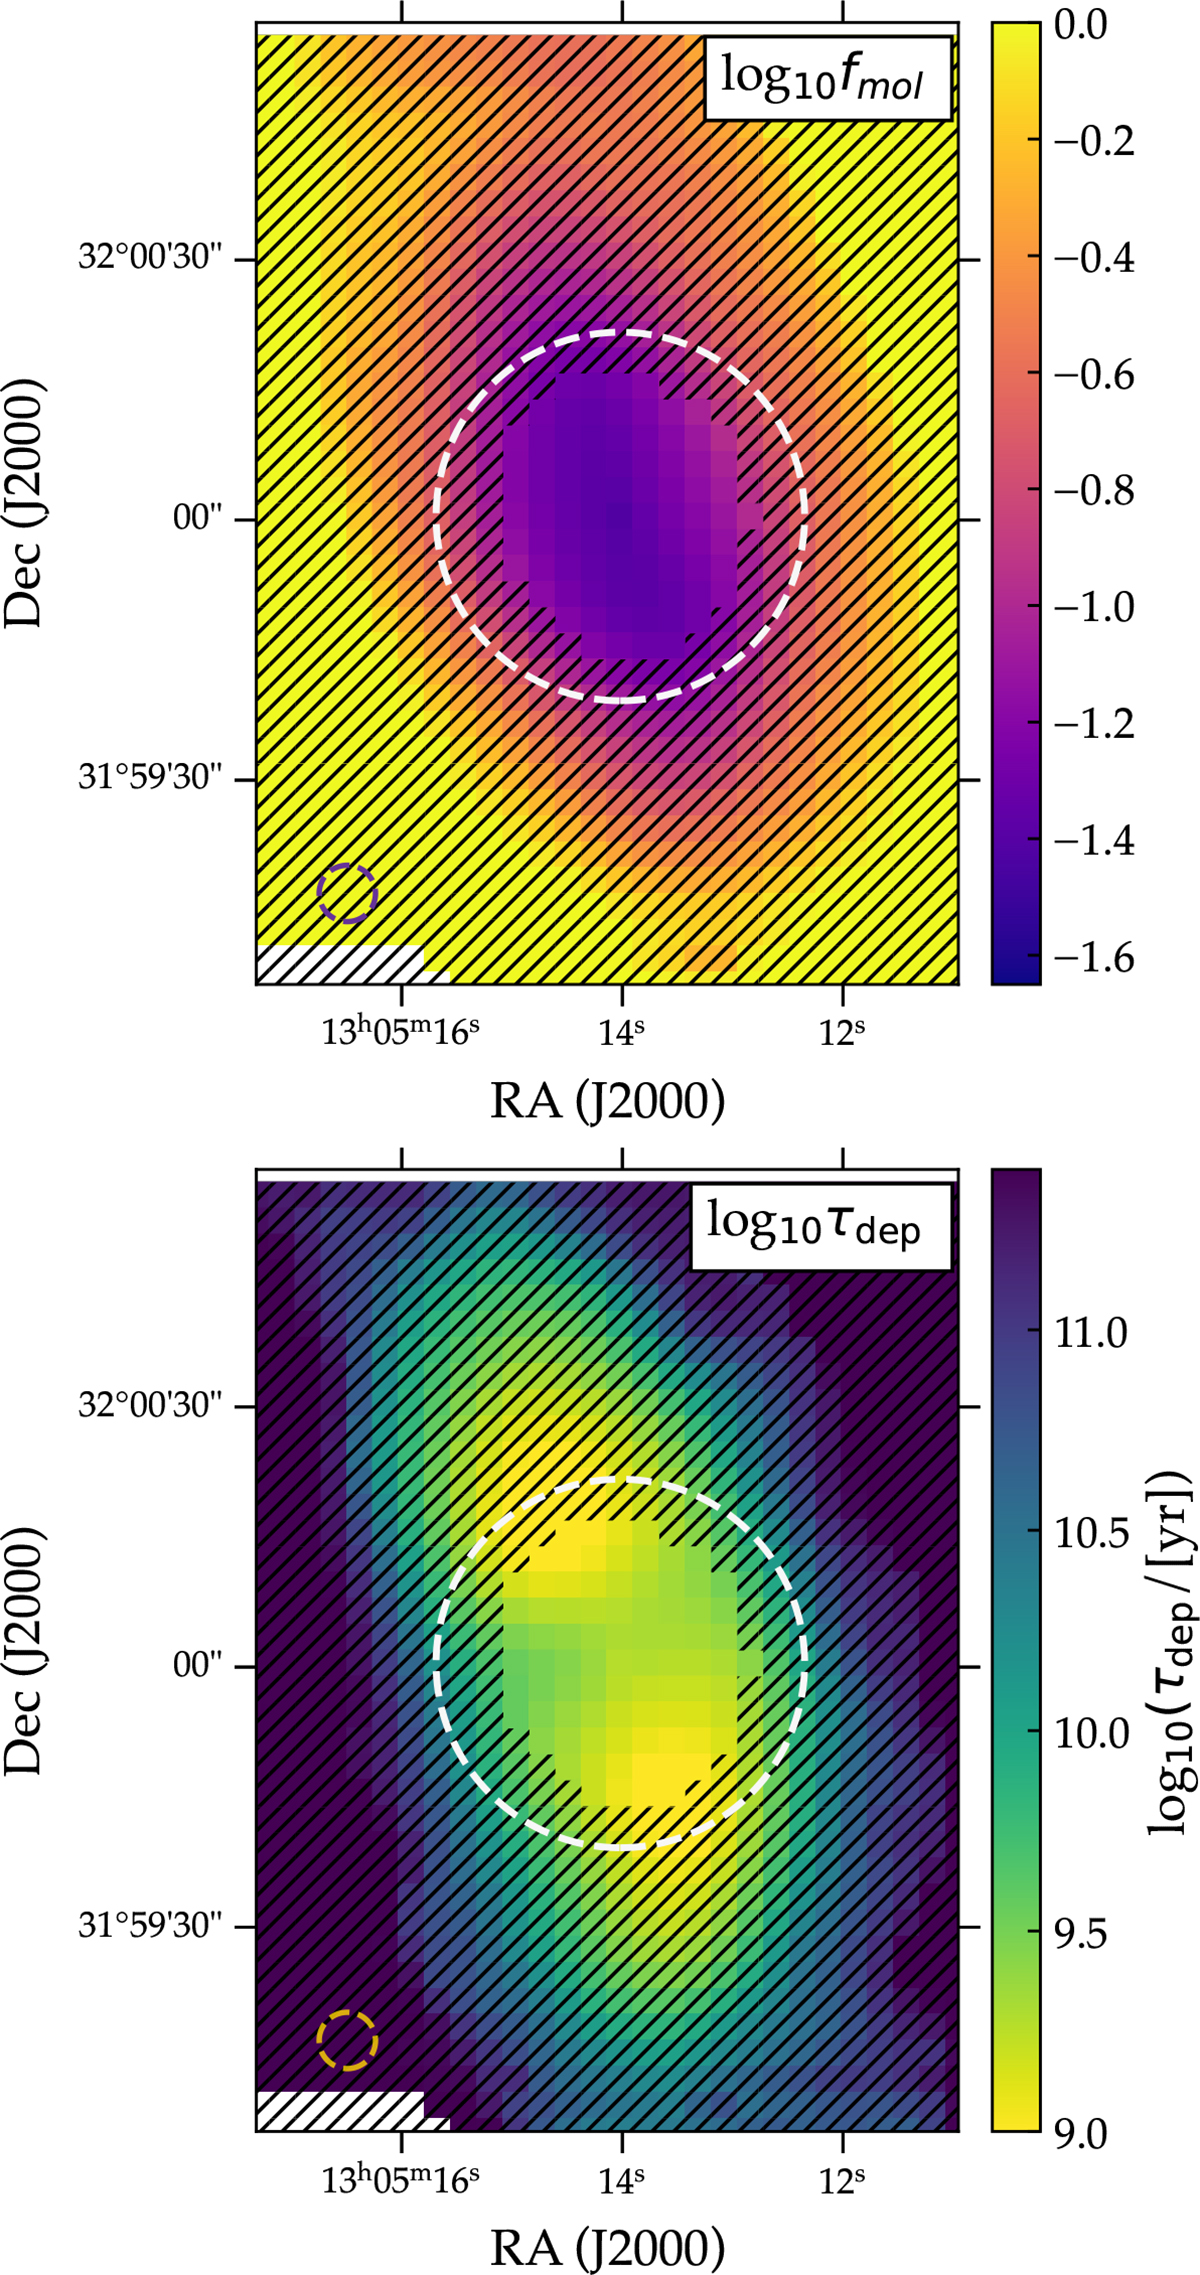
Fig. 5.
Download original image
Top: Log fmol, the molecular gas mass fraction. Bottom: Log τdep, the molecular depletion time. The hatched pixels are below a detection threshold of 4σ, where σ is the noise in the CO(1-0) moment 0 map. The dashed white circle represents NOEMA’s the HPBW.
Current usage metrics show cumulative count of Article Views (full-text article views including HTML views, PDF and ePub downloads, according to the available data) and Abstracts Views on Vision4Press platform.
Data correspond to usage on the plateform after 2015. The current usage metrics is available 48-96 hours after online publication and is updated daily on week days.
Initial download of the metrics may take a while.