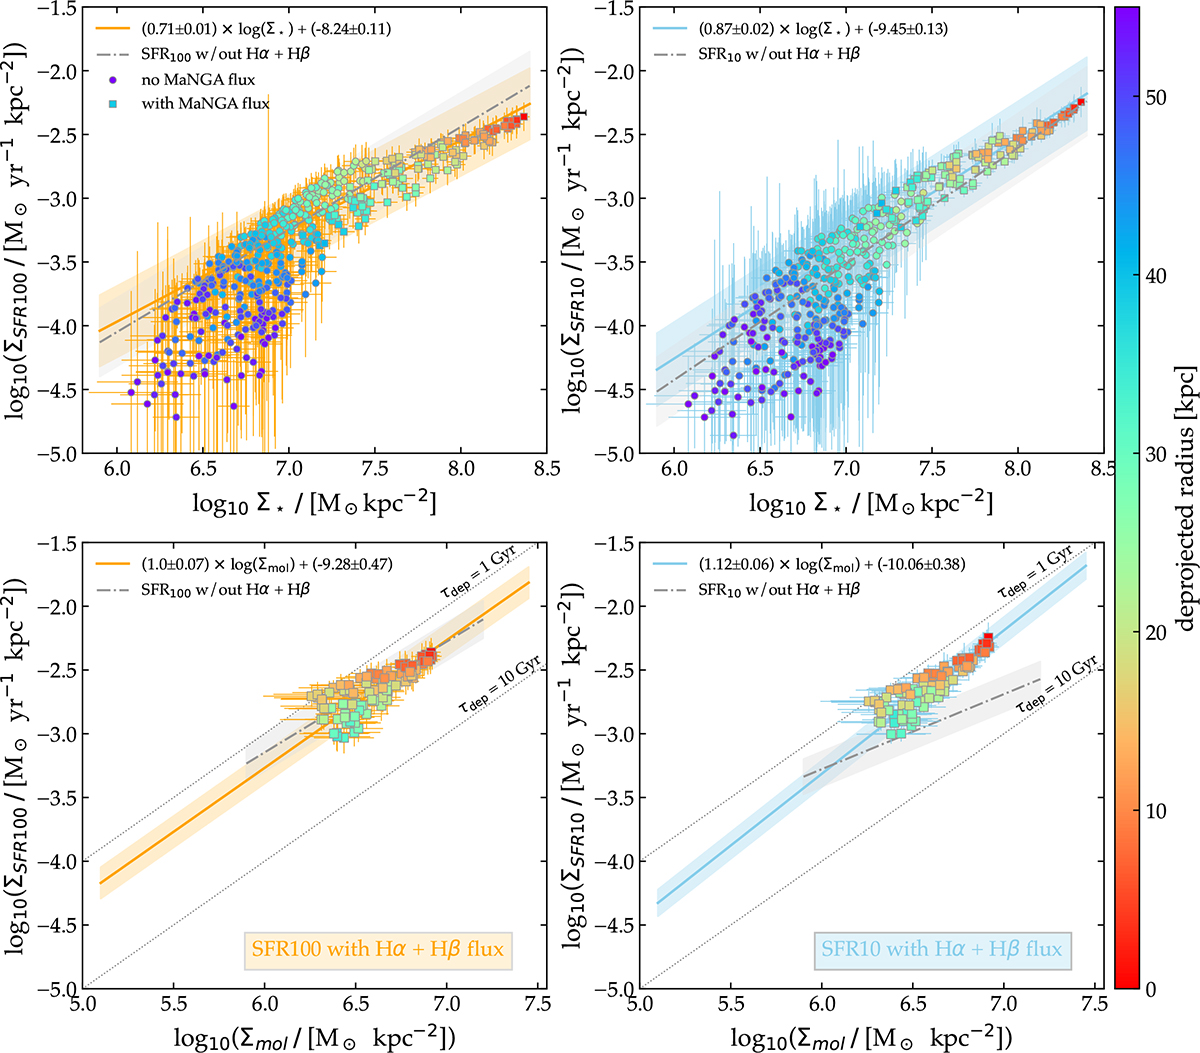
Fig. 9.
Download original image
Top: Resolved SFMS. The dash-dotted gray line in the left panel shows the fiducial ODR fit for ΣSFR100 without adding the Hα and Hβ fluxes (left-hand panel of Fig. 7). The dash-dotted gray line in the right panel likewise indicates the fit for ΣSFR10 without the additional flux. The squares denote the pixels affected by the addition of the MaNGA fluxes; the circles are unchanged (outside the FoV). The thick solid orange and blue lines and the shaded area respectively represent the ODR linear fits and the 1σ scatter for the squares and circles. Bottom: Resolved Kennicutt-Schmidt relation. The squares and circle are the same as above. The dash-dotted gray line in both panels shows the ODR fit for ΣSFR100 (left) and ΣSFR10 (right) without adding the Hα and Hβ fluxes.
Current usage metrics show cumulative count of Article Views (full-text article views including HTML views, PDF and ePub downloads, according to the available data) and Abstracts Views on Vision4Press platform.
Data correspond to usage on the plateform after 2015. The current usage metrics is available 48-96 hours after online publication and is updated daily on week days.
Initial download of the metrics may take a while.