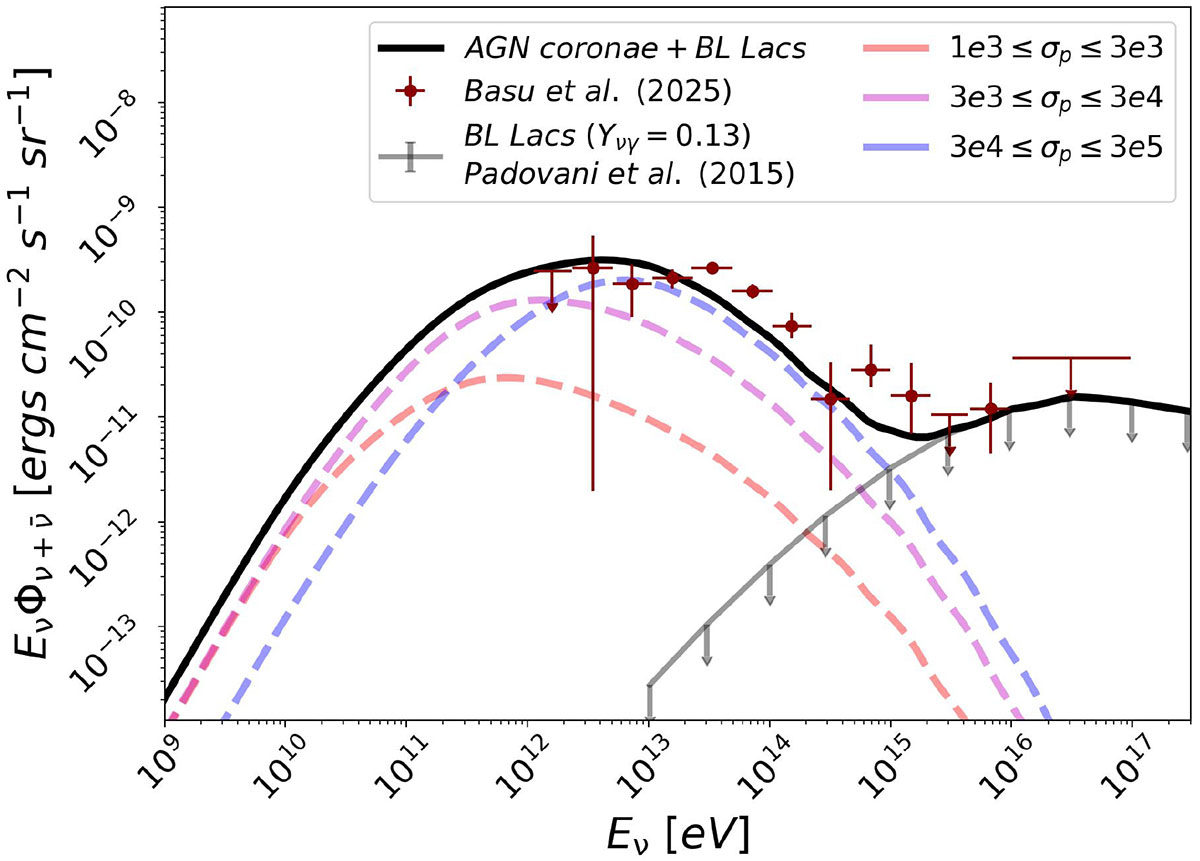
Fig. 1.
Download original image
Diffuse all-flavor neutrino flux spectrum. Burgundy markers show the IceCube diffuse flux spectrum as obtained from the most recent analysis of Basu et al. (2025). The solid black line shows the total flux. This comprises emission from AGN coronae predicted by our model (up to ∼1015 eV) and from jetted AGNs (BL Lac sources according to Padovani et al. 2015) at higher energies. The contribution of sources with different σp values is shown with dashed colored lines – see the legend.
Current usage metrics show cumulative count of Article Views (full-text article views including HTML views, PDF and ePub downloads, according to the available data) and Abstracts Views on Vision4Press platform.
Data correspond to usage on the plateform after 2015. The current usage metrics is available 48-96 hours after online publication and is updated daily on week days.
Initial download of the metrics may take a while.