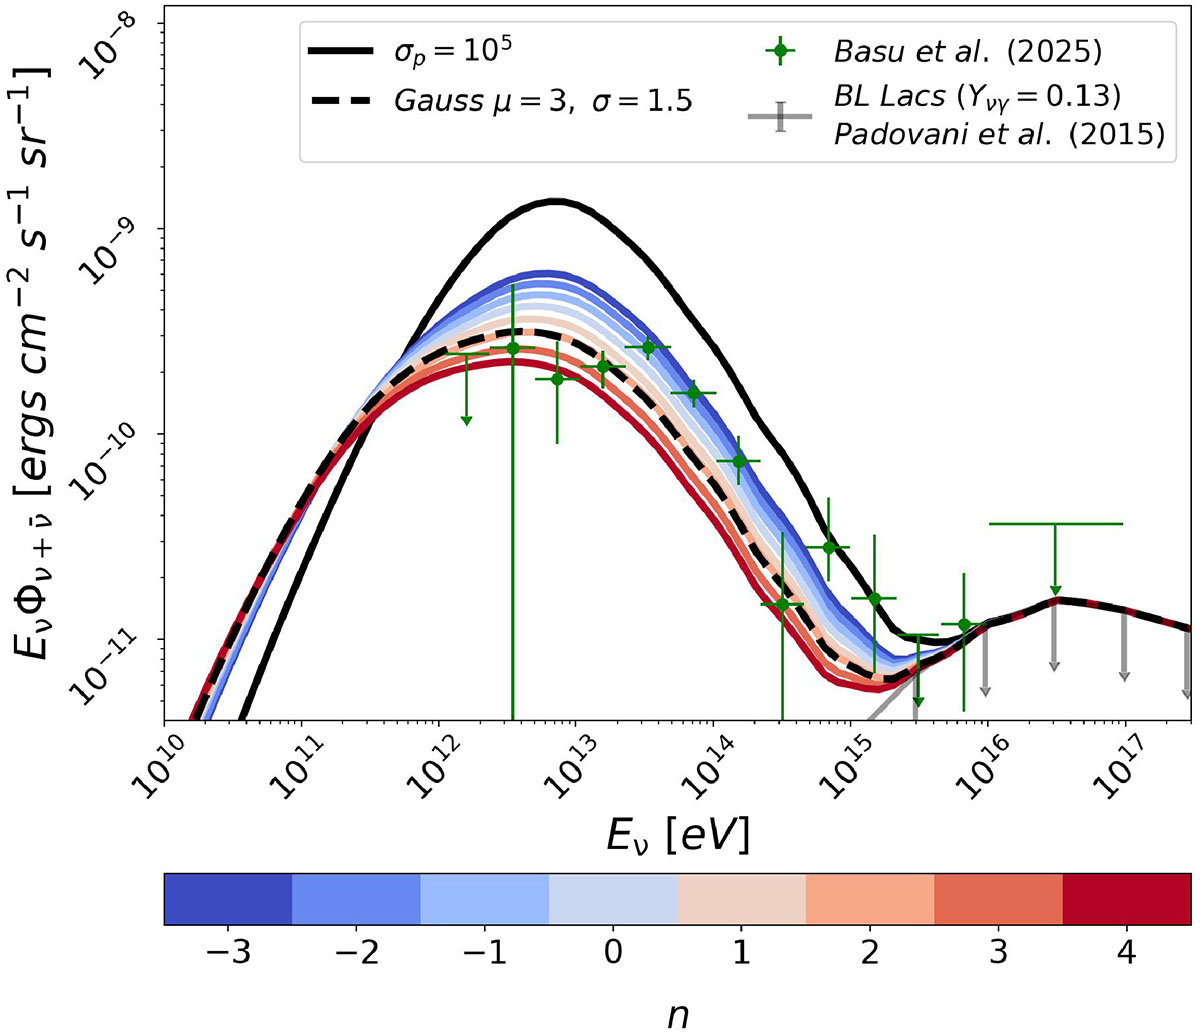
Fig. D.2.
Download original image
Similar as Fig. 1 except that black solid line shows result of the assumption that all AGN have σp = 105, while colored lines occur from power-law probability distributions of different slopes n (see colorbar) and black dashed line comes from P(σp) being a gaussian distribution with a mean value μ = 3 and a standard deviation of σ = 1.5.
Current usage metrics show cumulative count of Article Views (full-text article views including HTML views, PDF and ePub downloads, according to the available data) and Abstracts Views on Vision4Press platform.
Data correspond to usage on the plateform after 2015. The current usage metrics is available 48-96 hours after online publication and is updated daily on week days.
Initial download of the metrics may take a while.