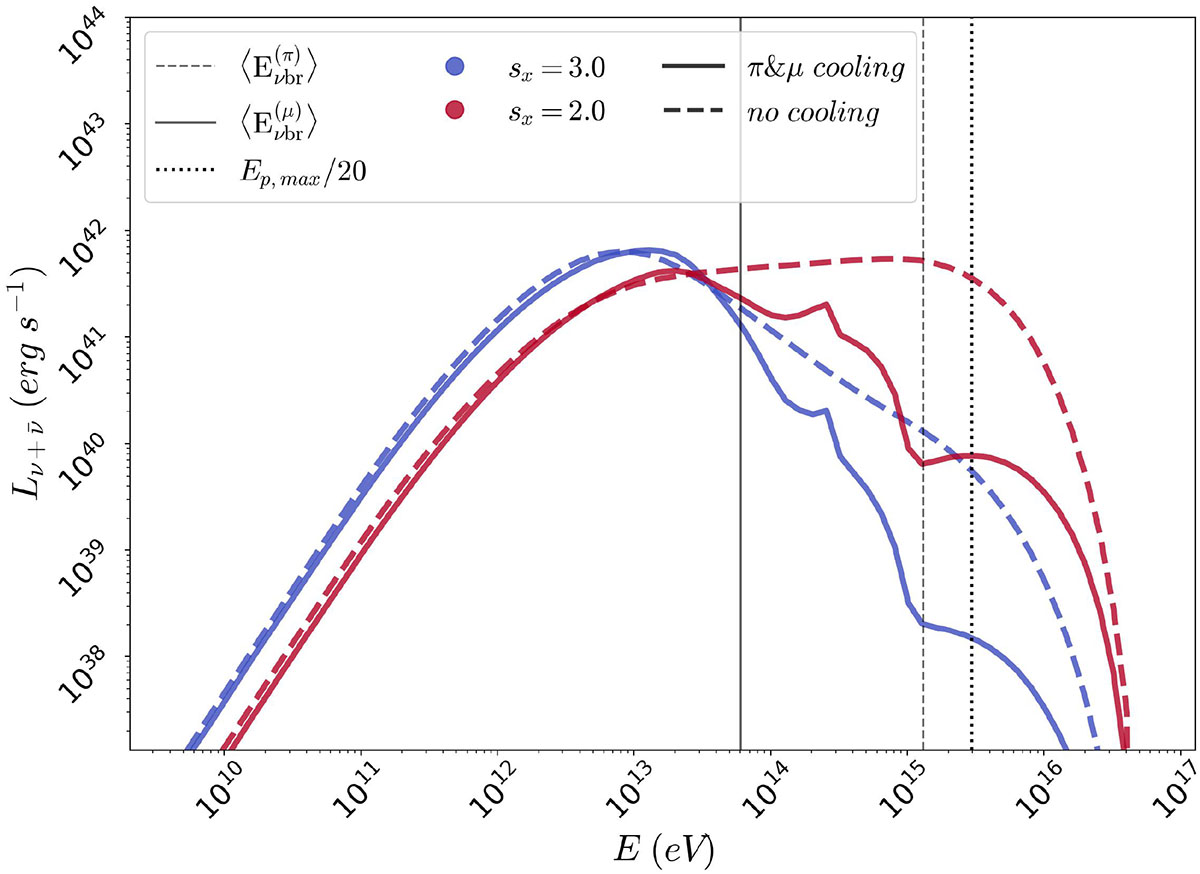
Fig. B.1.
Download original image
Neutrino spectra displaying the effect of the proton distribution post-break slope sp for the NGC 1068 case– see Appendix A. Red and blue refer to sp = 2 and 3 respectively. Solid lines include π and μ cooling while dashed lines neglect it. The solid and dashed vertical lines show the position of the cooling break for each species according to Eq. A.1. The dotted line refers to the neutrino energy produced by the most energetic protons of the distribution.
Current usage metrics show cumulative count of Article Views (full-text article views including HTML views, PDF and ePub downloads, according to the available data) and Abstracts Views on Vision4Press platform.
Data correspond to usage on the plateform after 2015. The current usage metrics is available 48-96 hours after online publication and is updated daily on week days.
Initial download of the metrics may take a while.