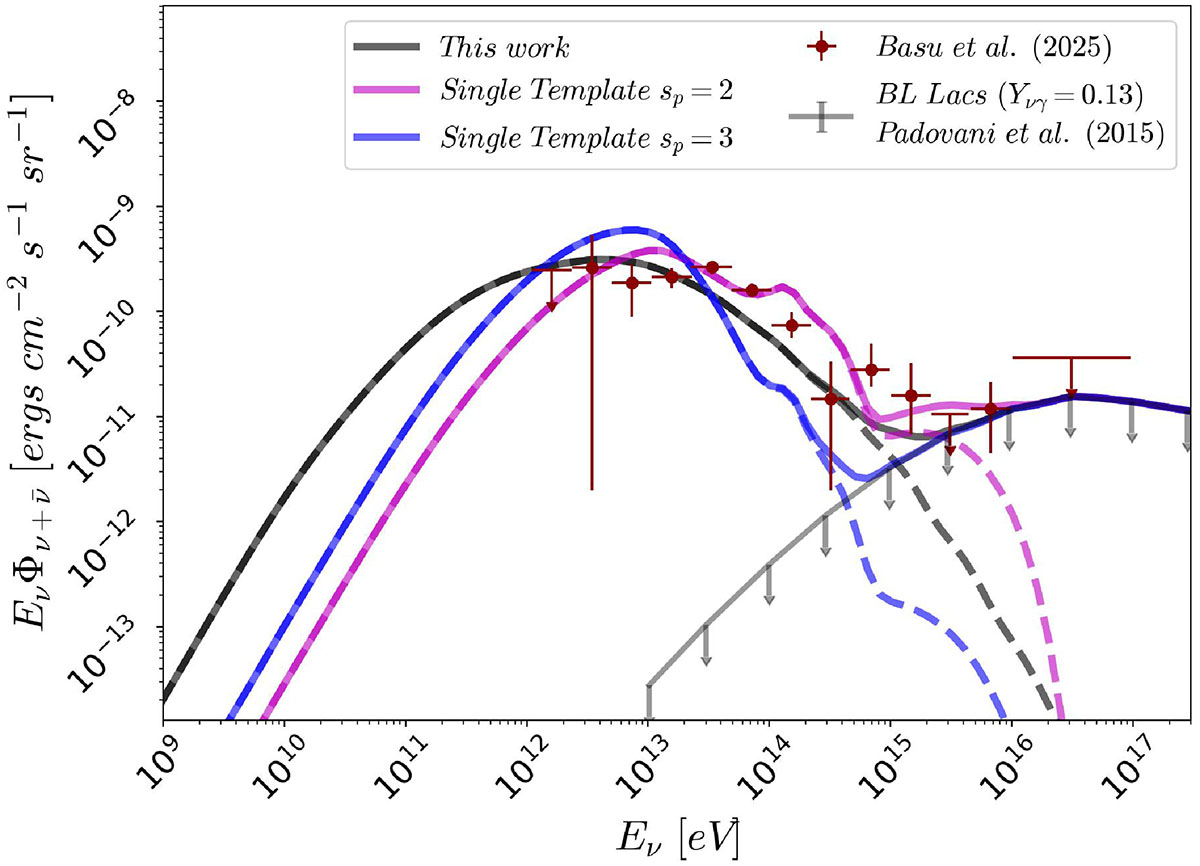
Fig. B.2.
Download original image
Same as Fig. 1. Magenta and blue lines correspond to the calculation of the diffuse flux assuming that all the sources have the same spectral shape as NGC 1068 (for sp = 2 and 3 respectively – see fig. B.1) re-normalized in respect to LX and the pγ efficiency. Dashed lines refer to the coronal model itself while solid lines also include the BL Lac population.
Current usage metrics show cumulative count of Article Views (full-text article views including HTML views, PDF and ePub downloads, according to the available data) and Abstracts Views on Vision4Press platform.
Data correspond to usage on the plateform after 2015. The current usage metrics is available 48-96 hours after online publication and is updated daily on week days.
Initial download of the metrics may take a while.