Fig. 11.
Download original image
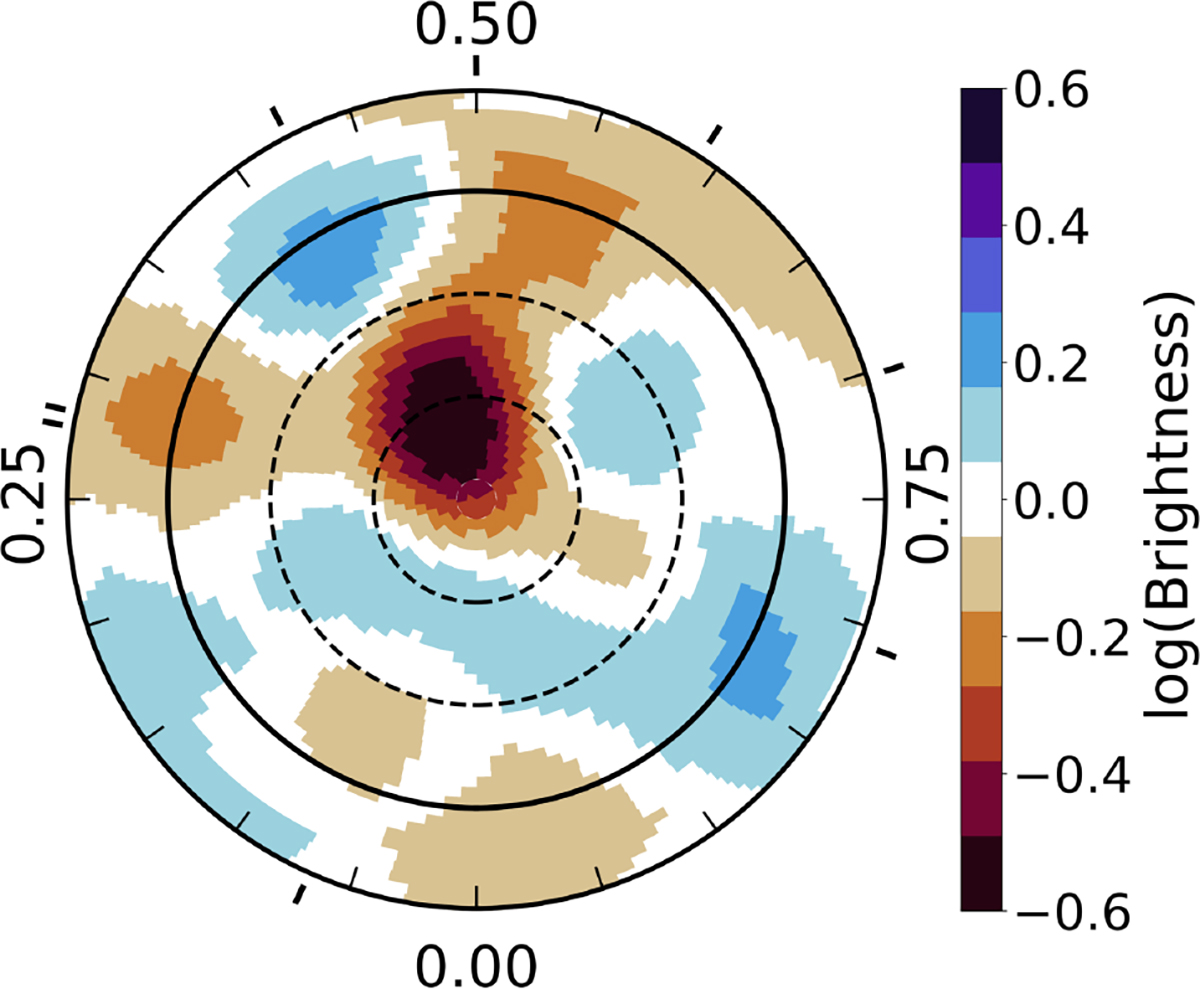
Logarithmic brightness map of the surface of JH 223 in November, 2019. The star is shown in a flattened polar view down to a latitude of −30°, with the equator indicated by a solid line and latitudes of 60° and 30° by dashed lines. Outer radial ticks mark the phases of spectropolarimetric observations. Cool spots are shown in brown shades, while bright plages are shown in blue shades.
Current usage metrics show cumulative count of Article Views (full-text article views including HTML views, PDF and ePub downloads, according to the available data) and Abstracts Views on Vision4Press platform.
Data correspond to usage on the plateform after 2015. The current usage metrics is available 48-96 hours after online publication and is updated daily on week days.
Initial download of the metrics may take a while.